Smoothing in cartographic representation and generalization
• • •
Simplification and smoothing tools in LorikGISTools?
How does it work in practice?
It is often necessary to simplify the shape of your curves in a GIS in order to adapt their representation to a given scale.
In this article, we will take a step-by-step approach to discover several of the GISTools dedicated to this task. We will highlight their ease of use and the quality of the results, thanks to a series of powerful and innovative algorithms.
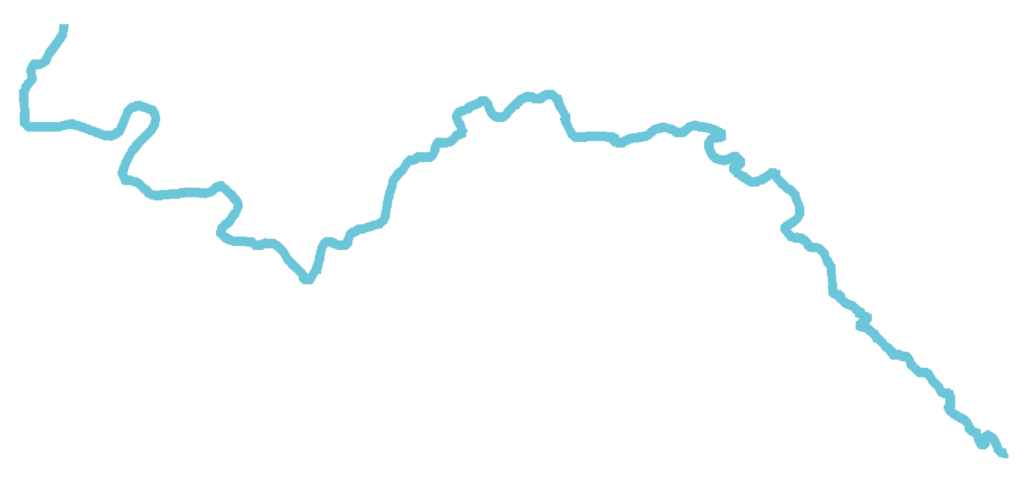
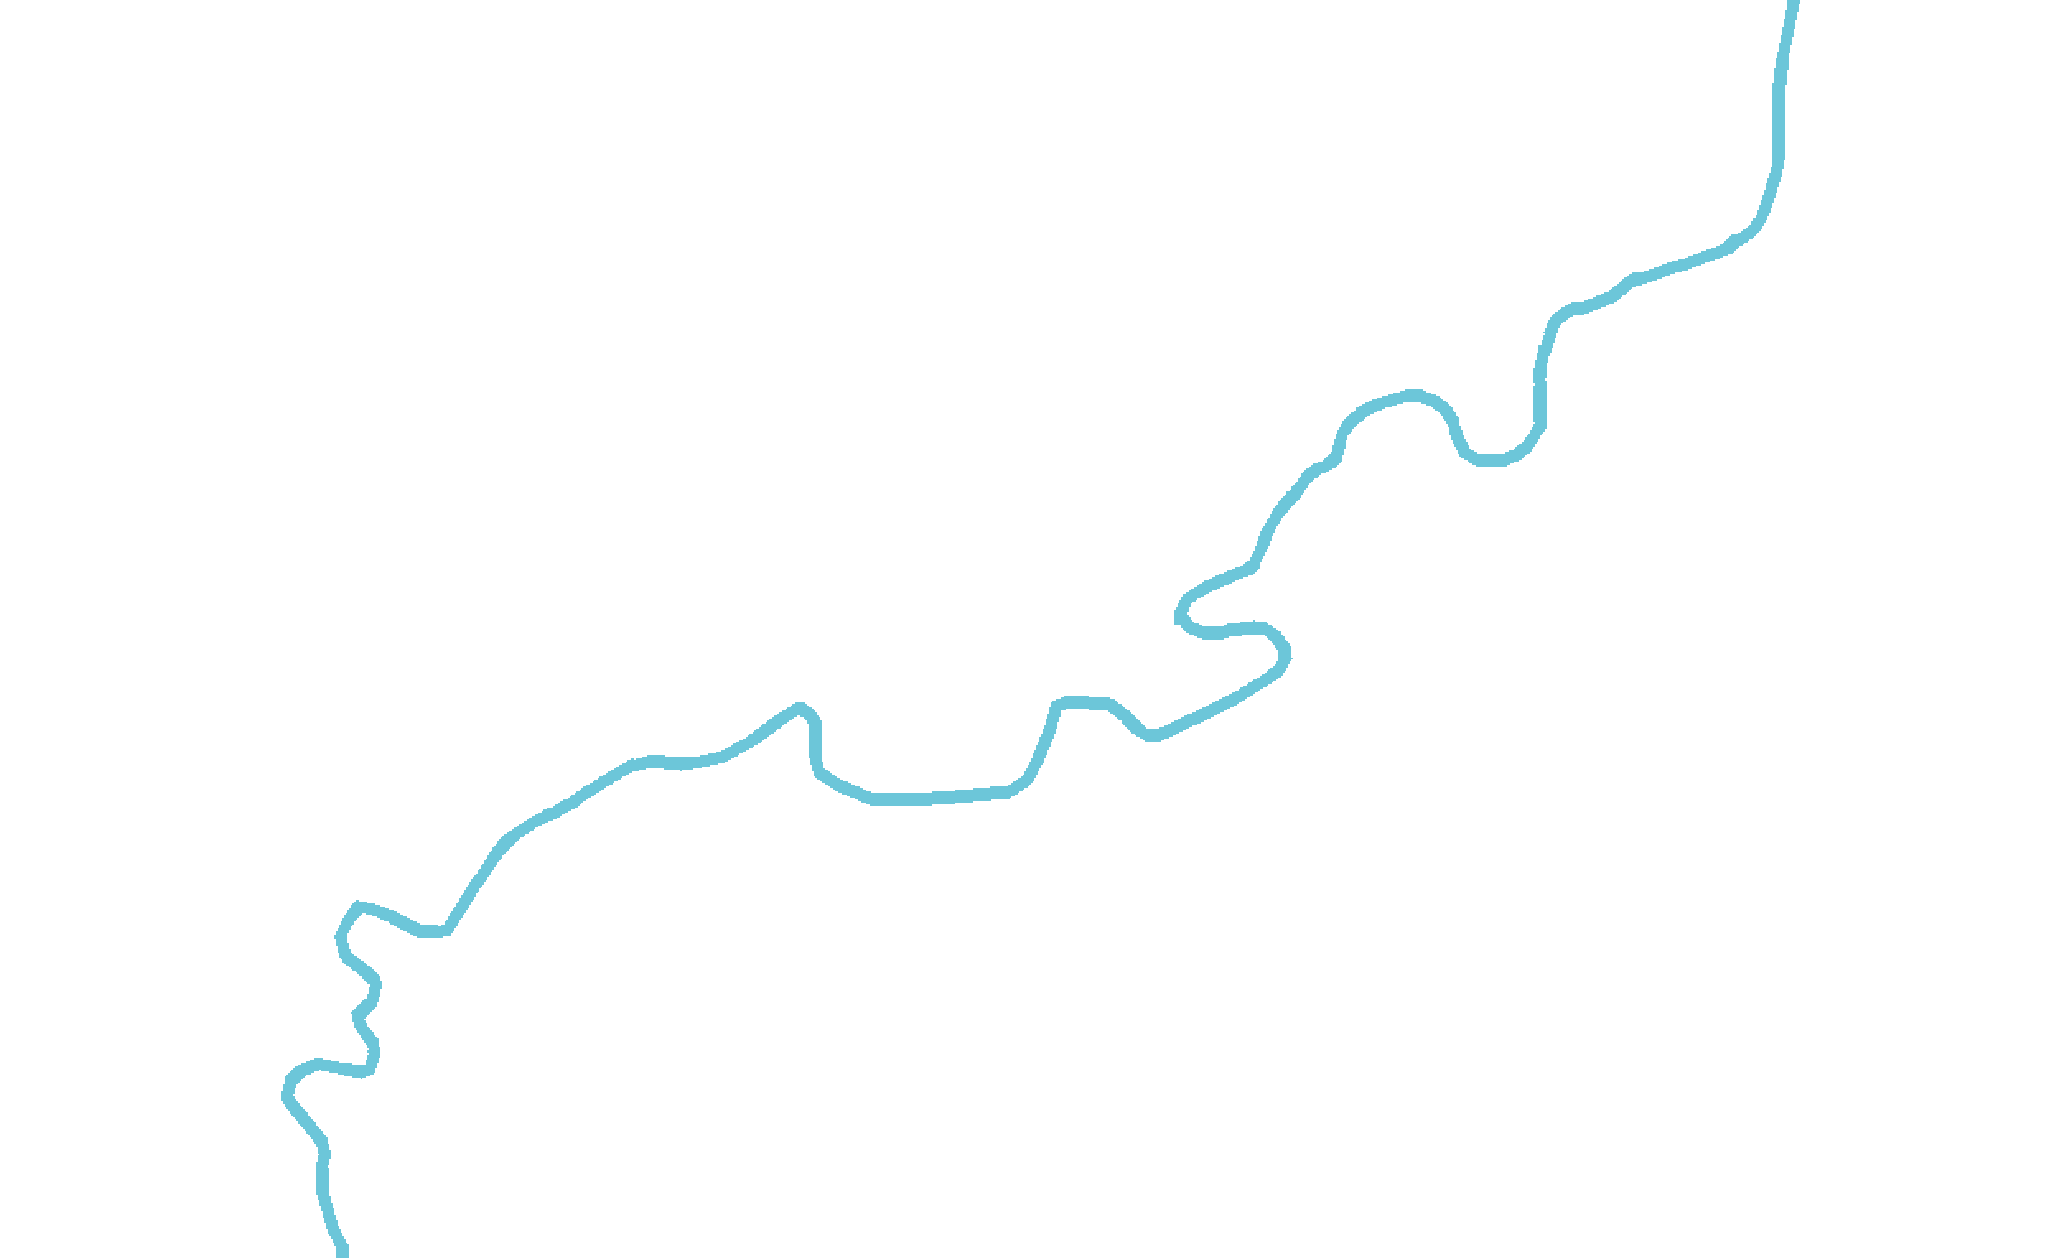
Let’s take the outline of a river as an example. Here is an overview:
1- First operation: reducing the number of points.
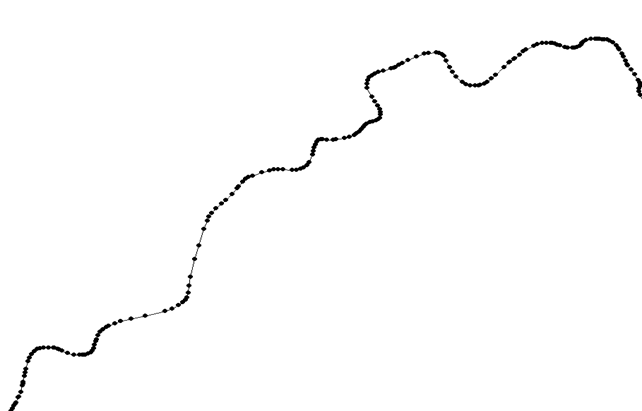
Accurate data often involves a very large number of points, and the first step is to reduce their number. The same curve with its points appears as follows:
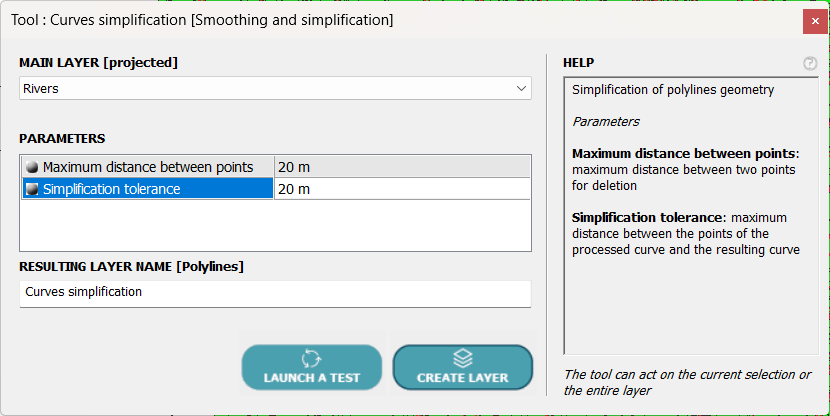
Let’s use the POLYLINES tool ⇒ Smoothing and Simplification ⇒ Curve Simplification, which looks like this:
Once the layer to be processed has been selected, two parameters must be entered:
- The maximum distance between two points, which allows points whose distance to the next or previous point is less than this value to be deleted.
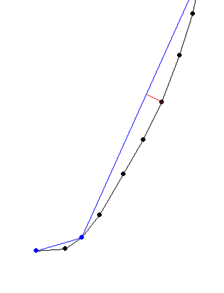
- The simplification tolerance, which allows a point to be deleted if its distance to the simplified curve is less than this value, as shown in the following diagram:
The red segment highlights the distance between a point on the black curve and the calculated curve in blue.
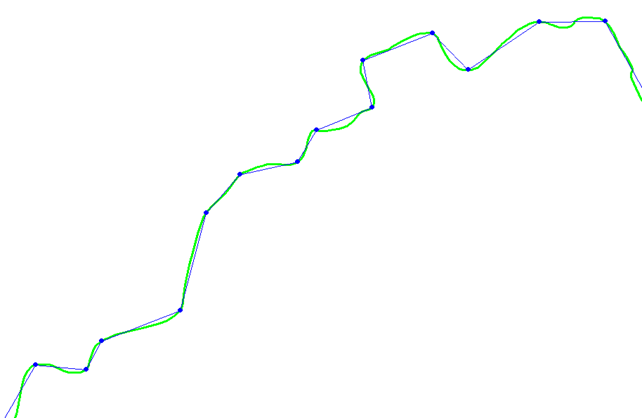
In our example, the result obtained after applying the POLYLINES ⇒ Smoothing and Simplification ⇒ Curve Simplification algorithm is as follows:
2- Removing oscillations
At the desired scale, displaying a series of small turns is not useful and actually makes it harder to read.
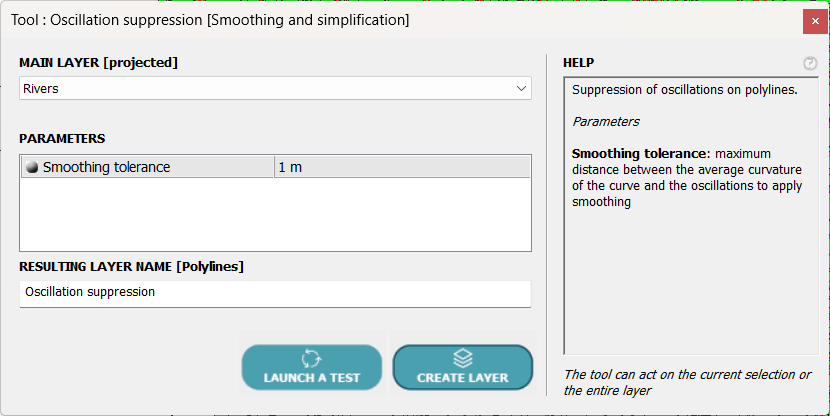
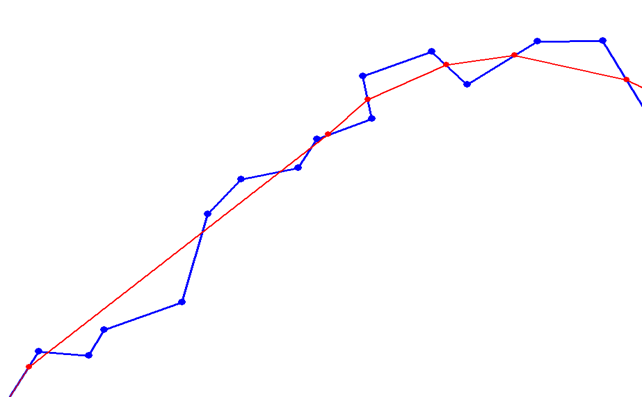
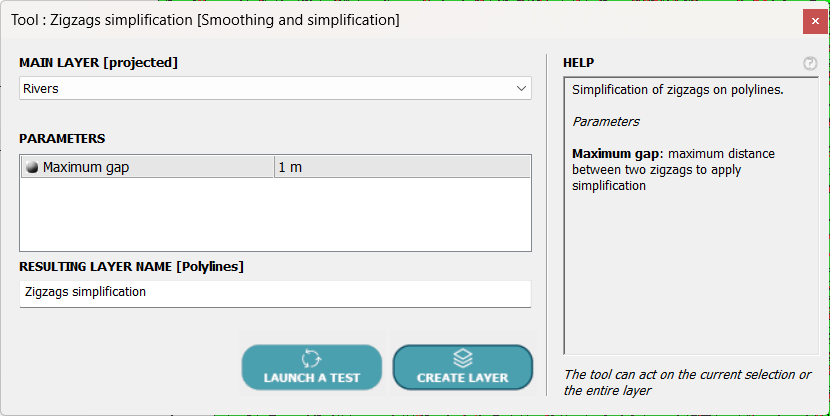
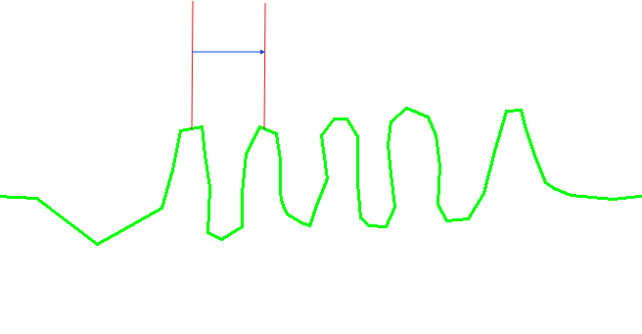
The tool we are going to use, POLYLINES ⇒ Smoothing and Simplification ⇒ Oscillations suppression, searches for the smoothest curve around which the original curve oscillates, or zigzags to use a more common term.
The only parameter required is the maximum distance between the original curve and the calculated curve. Unlike the simplification tool, new points can be added, but always on the original curve.
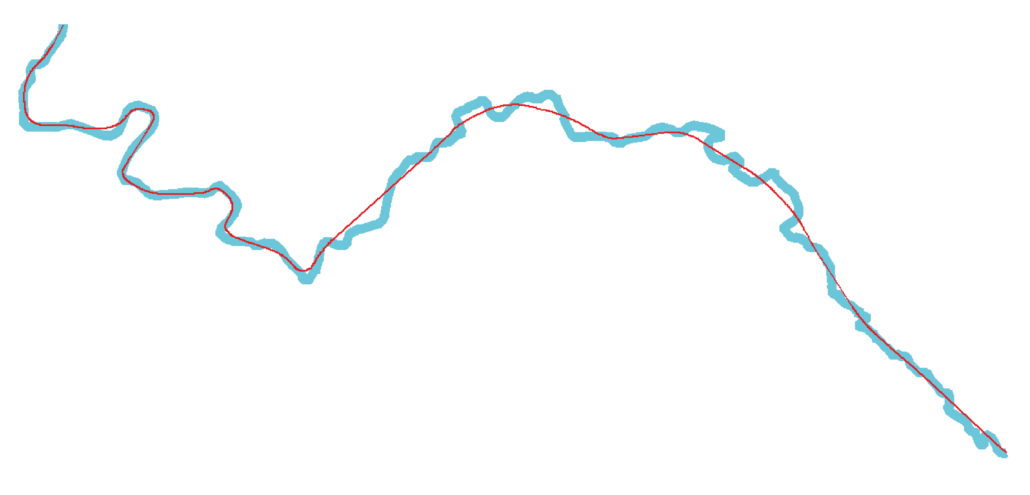
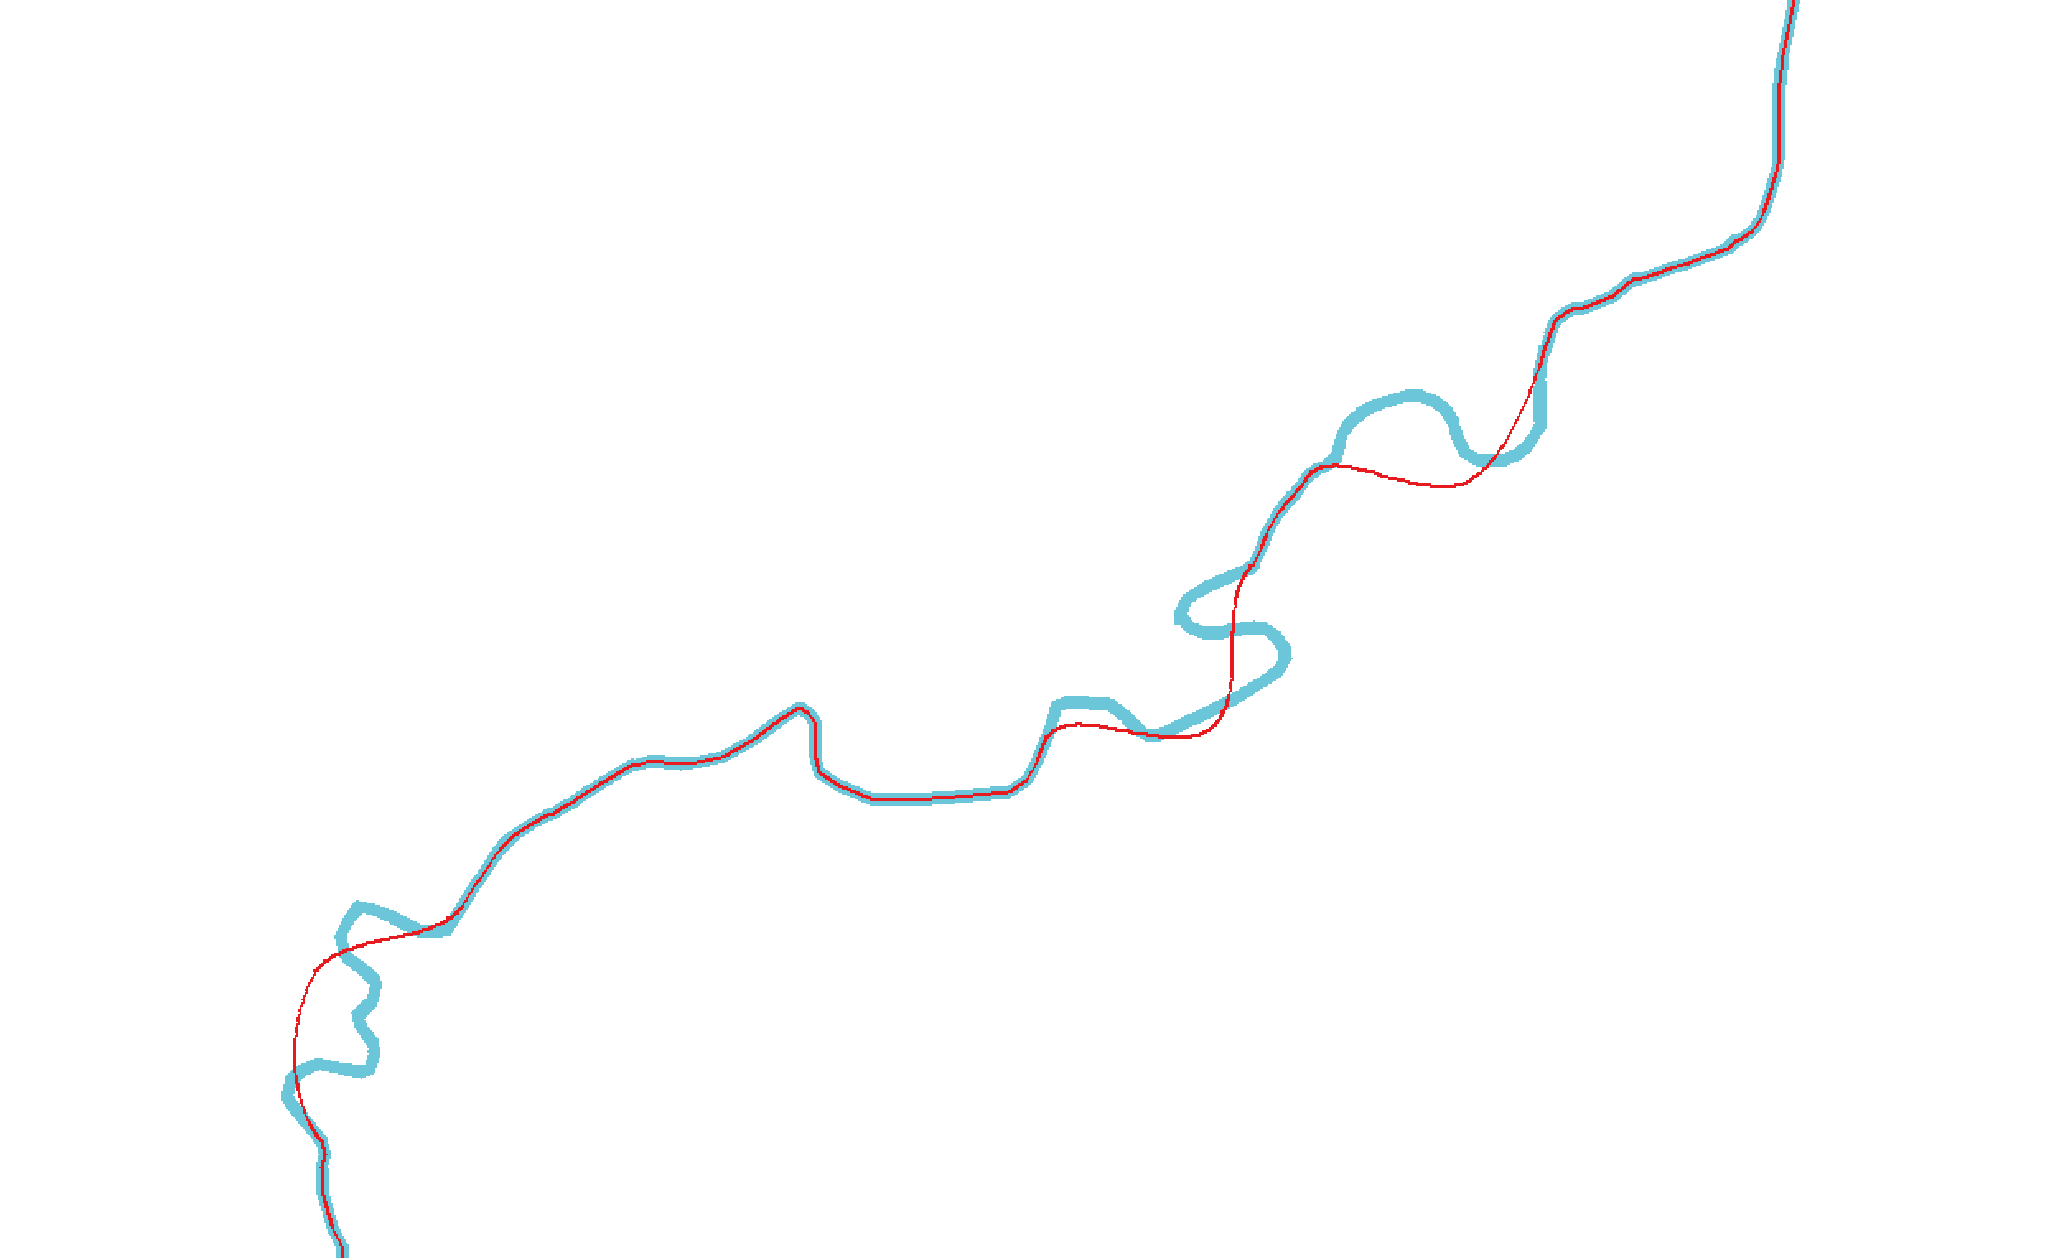
In our example, the result is as follows:
The simplified curve is shown in blue, and the curve after removing the oscillations is shown in red.
3- Smoothing curves
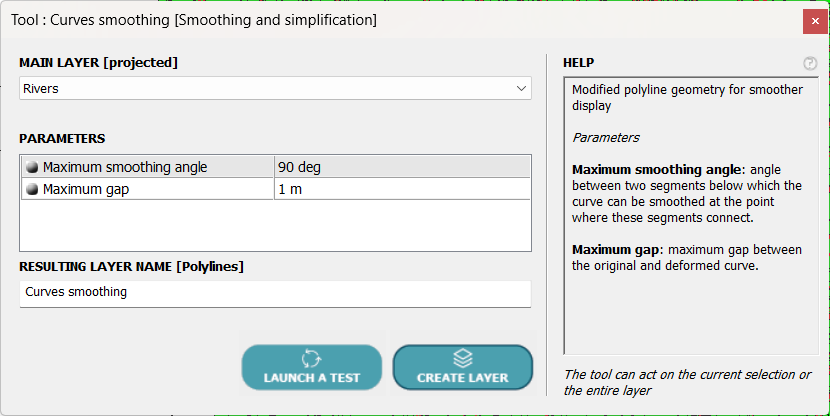
All that remains is to give the curve a more rounded appearance using the POLYLINES tool ⇒ Smoothing and Simplification ⇒ Curves Smoothing, which is designed for this purpose and looks like this:
This tool will round the curve according to two parameters:
- A maximum angle so as not to smooth between two segments whose angle is greater than this value.
- A maximum deviation between the initial curve and the calculated curve.
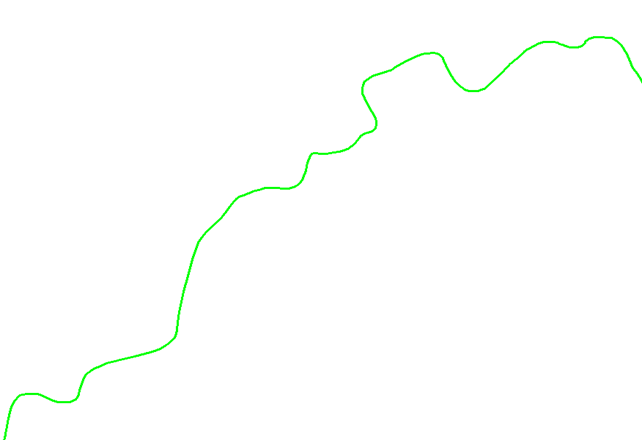
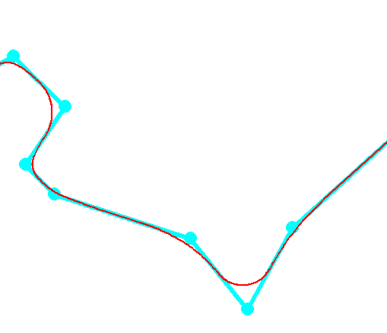
The result is as follows:
Final result
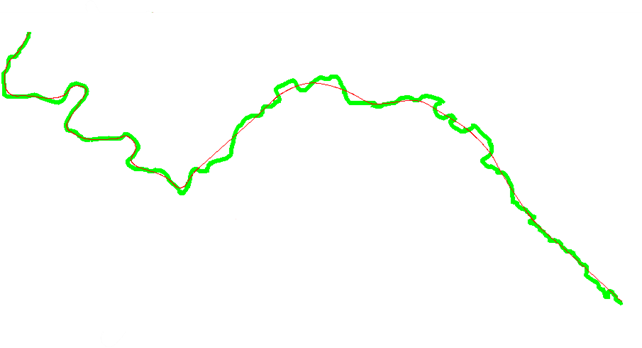
The easiest way to highlight the quality obtained after these three operations is to present the result for a real case, which gives us:
The sequence of tools allows us to refine the smoothing process and obtain a satisfactory result both for the graphical representation of the data and for the generalization of the GIS data, in other words, to simplify the data for reuse in a derivation of the map at a different scale.
