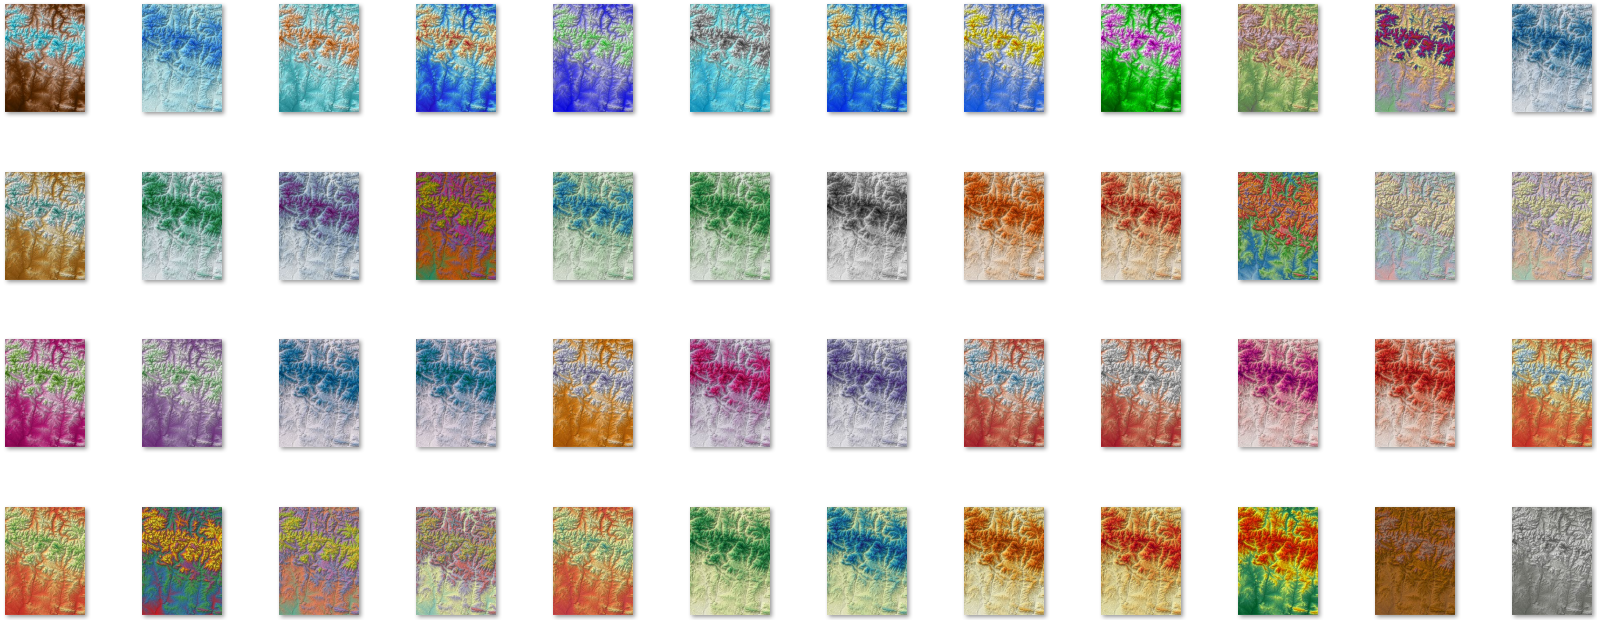
Relief images in a GIS like LorikGISTools
• • •
Creating a relief image?
Concretely, how does it work?
Creating a relief image from digital terrain models is an operation offered by several GIS software packages, such as QGIS or ARCGIS, but the solution proposed by LorikGISTools allows you to create these georeferenced images using a simple, powerful and fast tool, which has many advantages:
- Many color definition options
- Smoothing of elevation values at points
- Advanced smoothing of surfaces between points for a surface more representative of reality
- A single image for a set of adjacent DTMs A single image for a set of adjacent DTMs
- Image created in any possible georeferencing, even if different from that of the DTM
- Very high execution speed
- A simple interface.
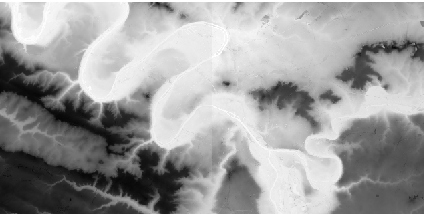
In this example where elevation is represented by a black value, we obtain:
The light direction
It is necessary to indicate from where comes the light that illuminates the terrain surface covered by the DTM. To do this, we must enter two angle values in the usual way:
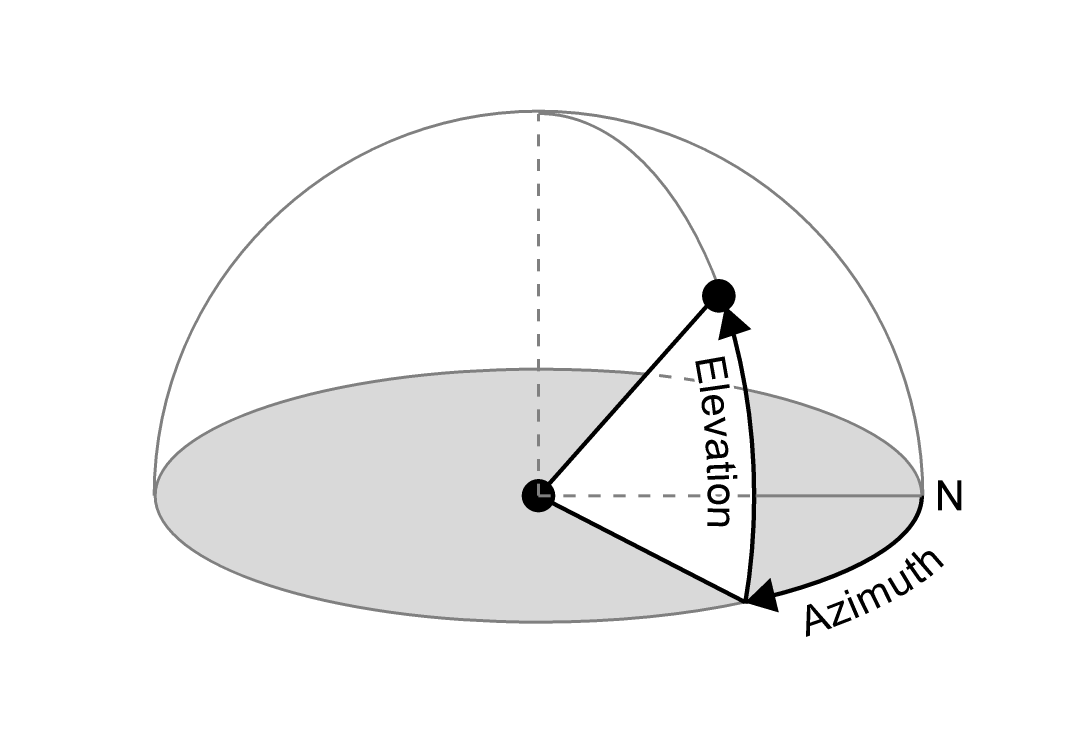
Elevation, which is the vertical angle, and Azimuth, the horizontal angle, as represented in the following diagram:
Azimuth being the horizontal angle between the light source and a reference axis, another attribute titled angle mode allows choosing this axis among three possibilities:
– The vertical direction of the image.
– North at the center of the image.
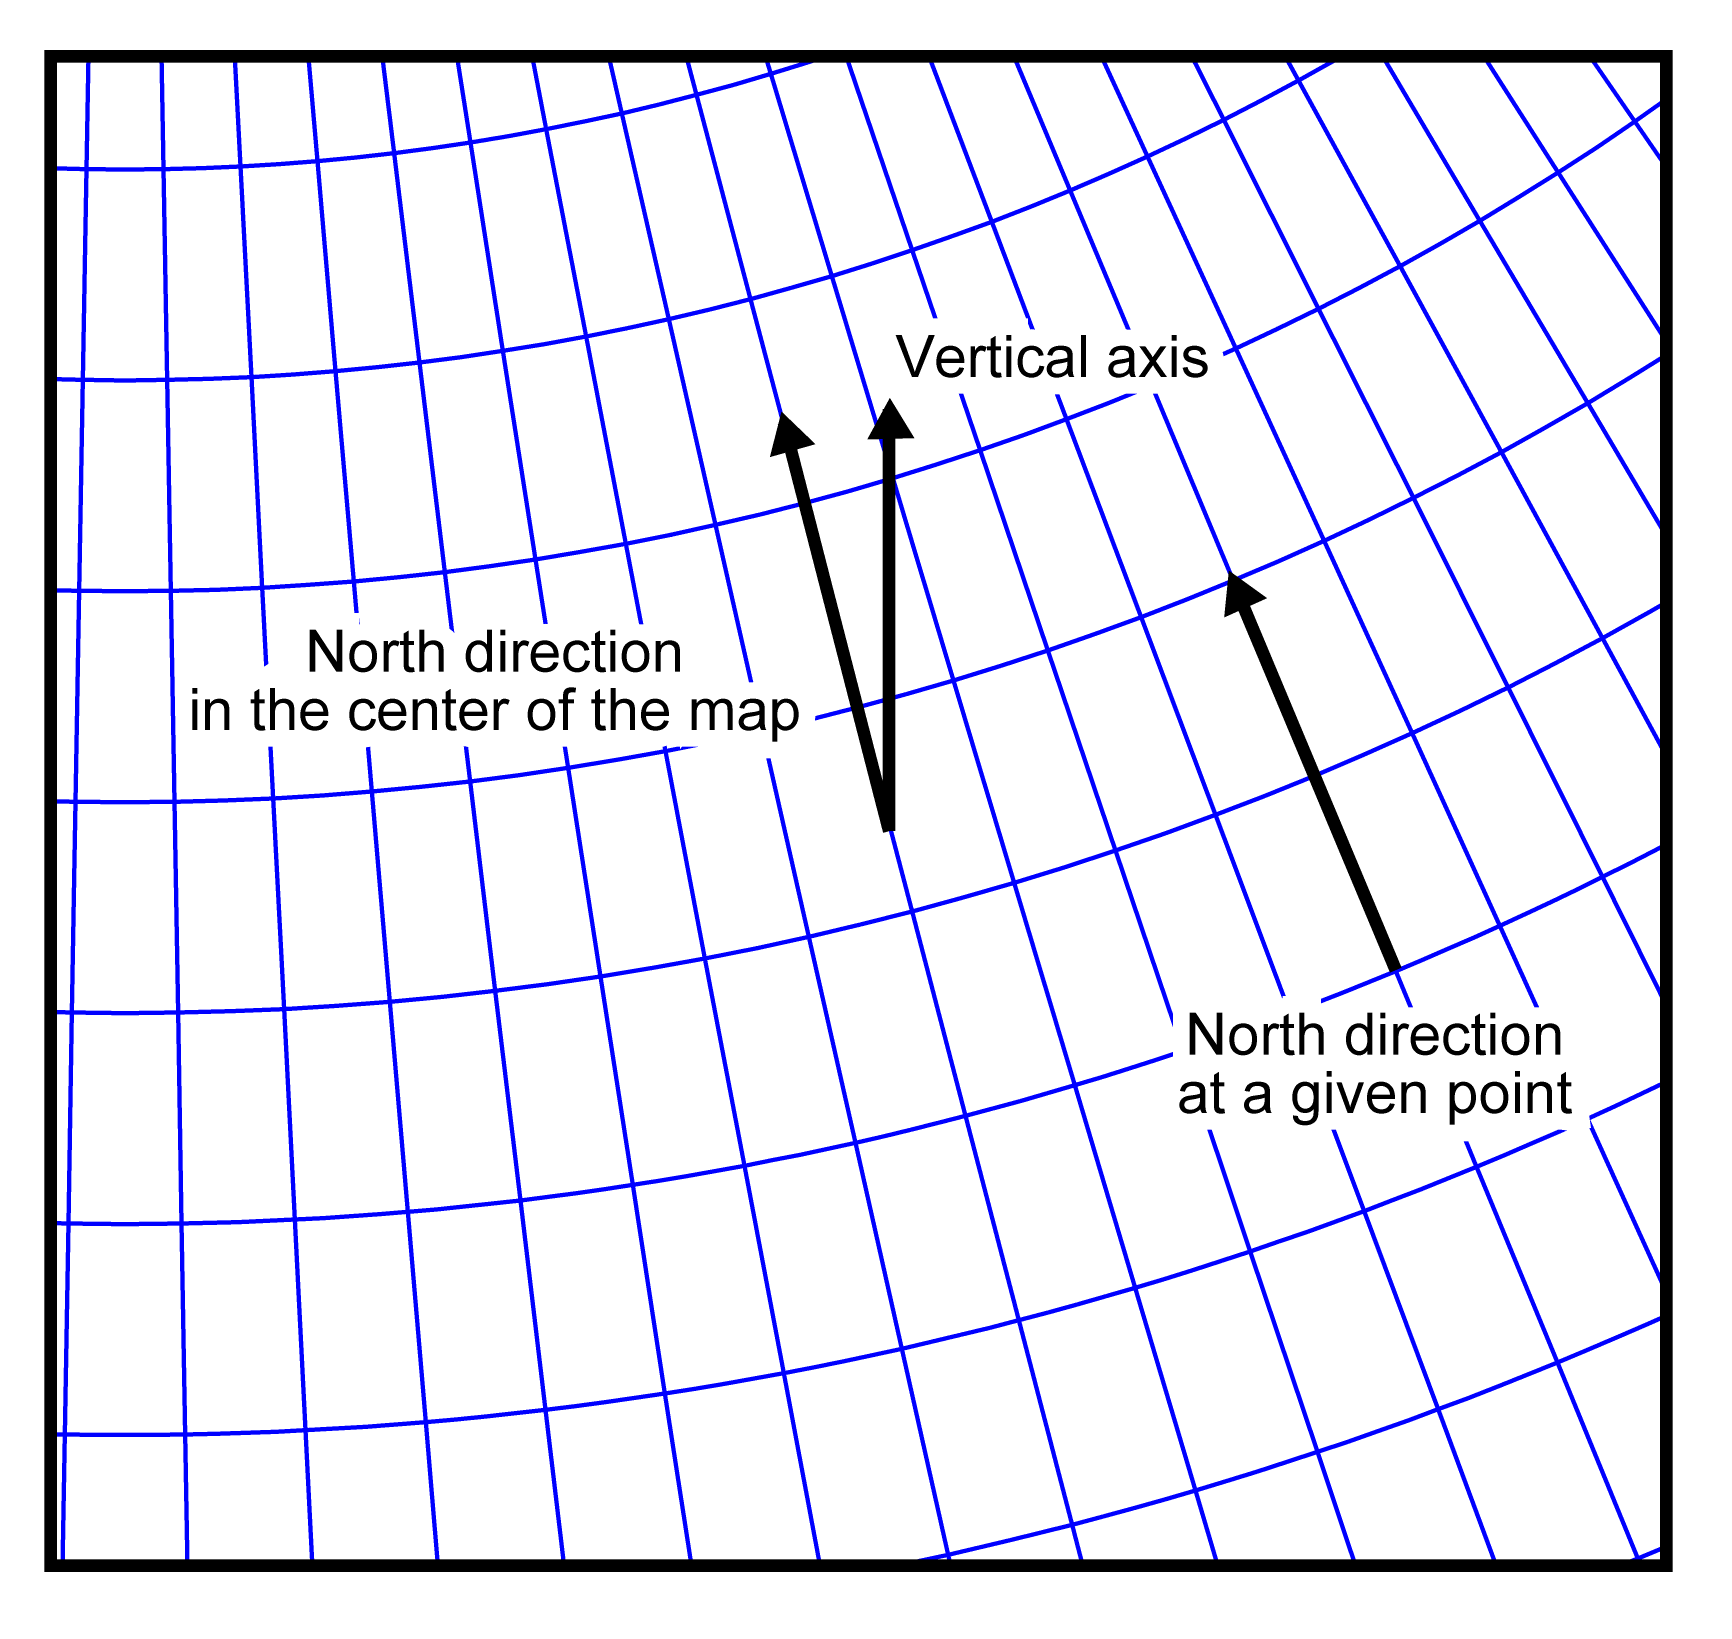
– North at each point of the image.
This last mode is much appreciated for large surfaces with a projection where north varies at each point as illustrated in this example using a UTM projection:
Brightness
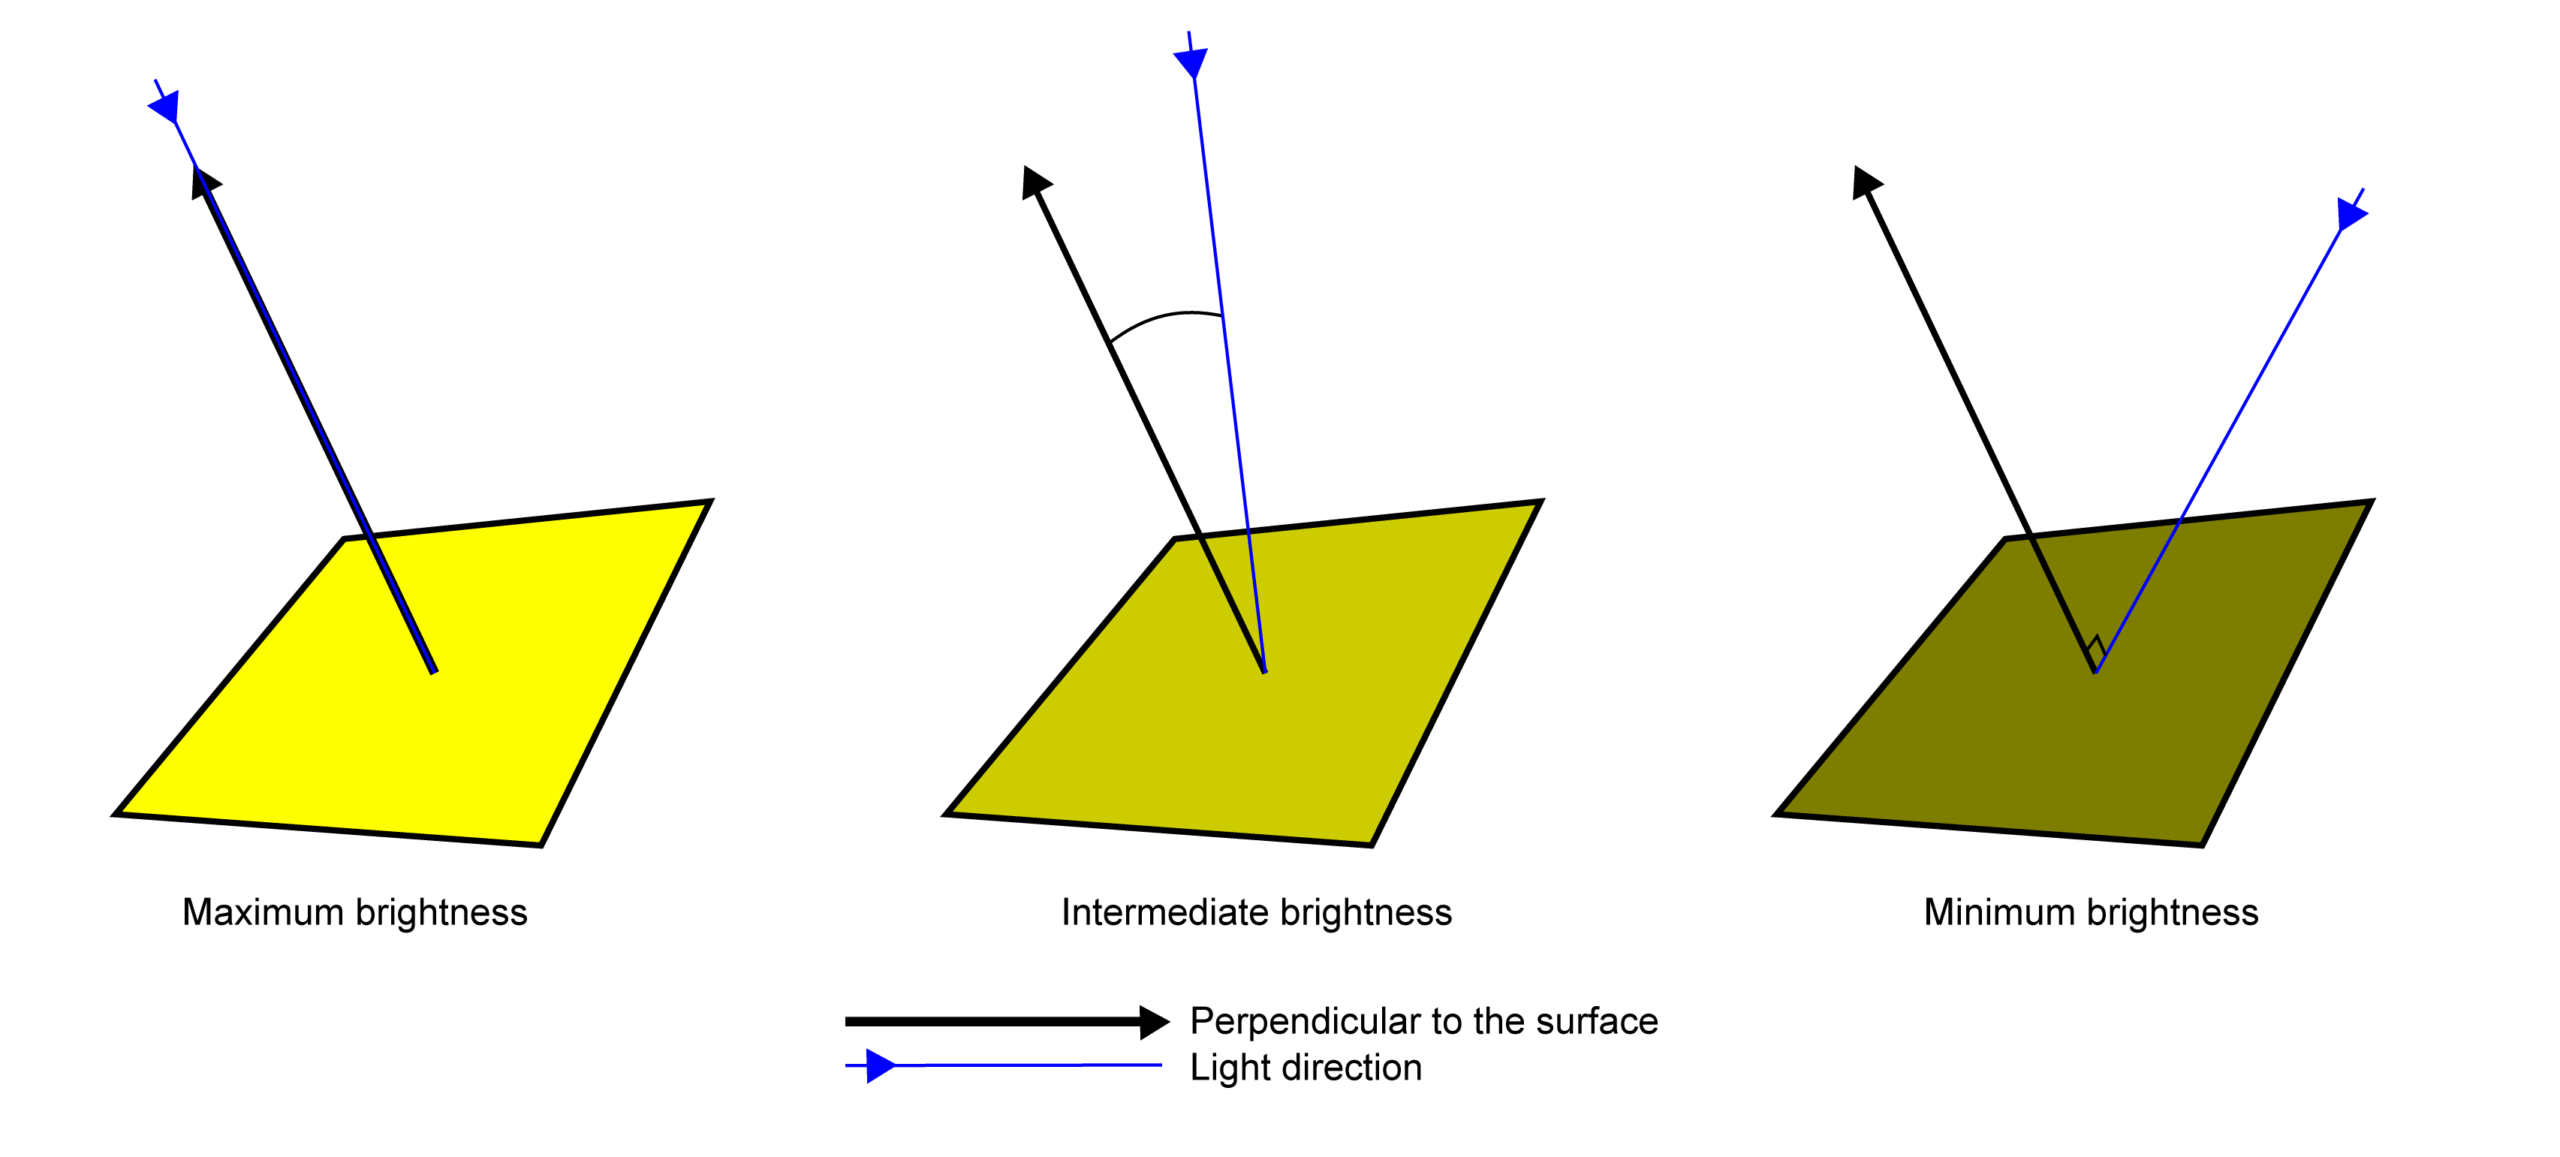
It is easily computed at each point. The closer the light direction is to the perpendicular to the surface, the greater is the brightness, as illustrated in the following example:
Smoothing elevation values at DTM points
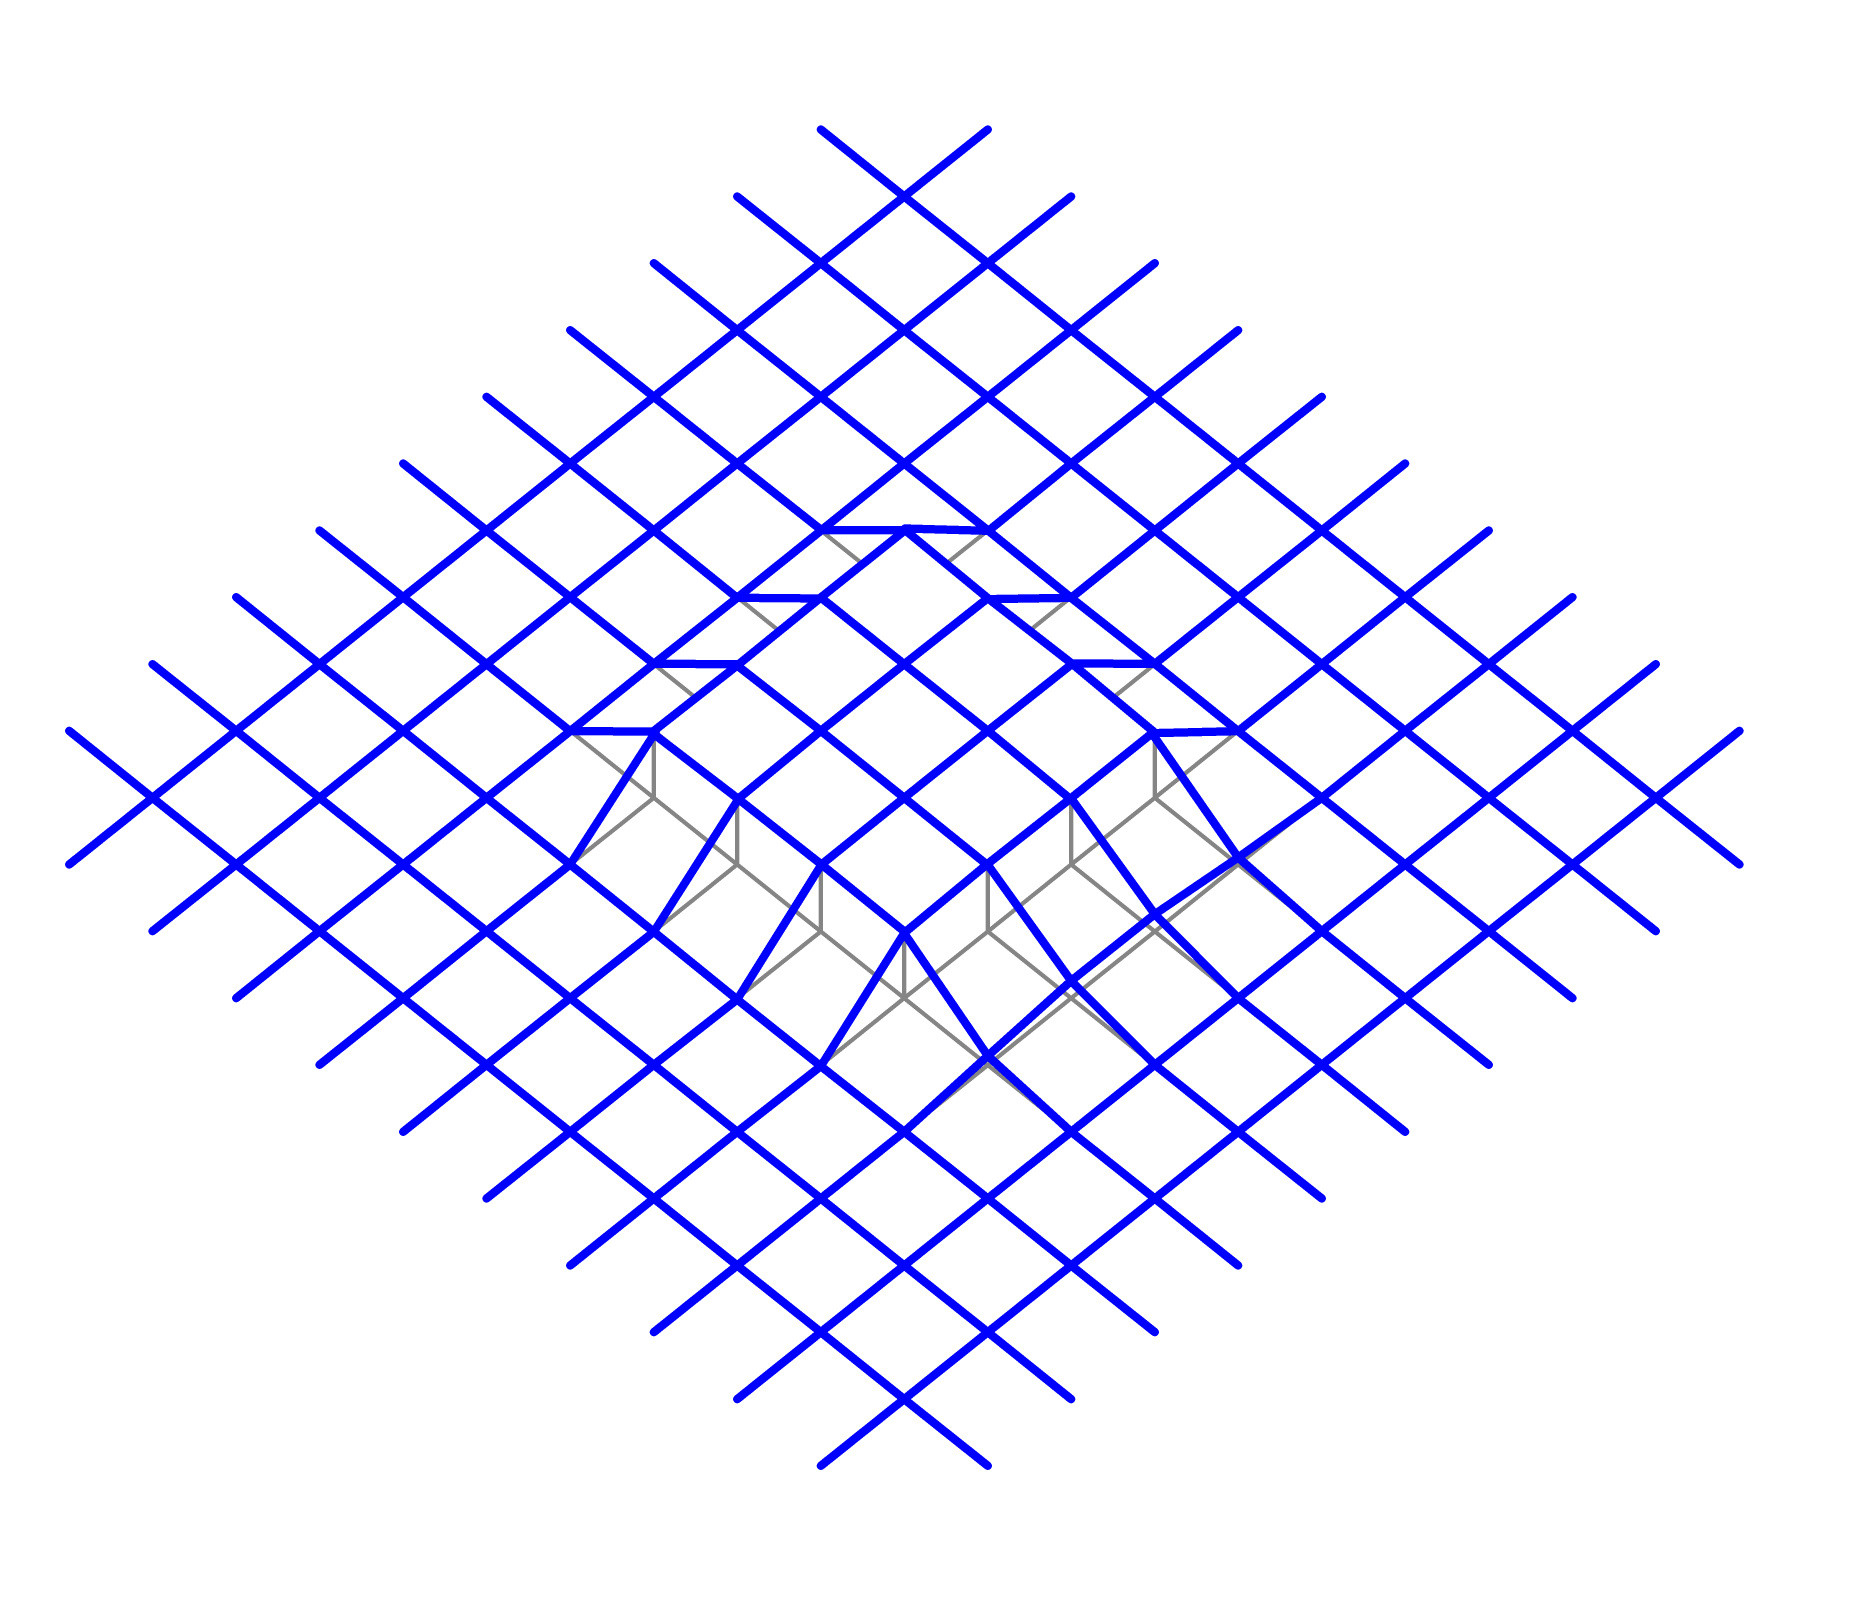
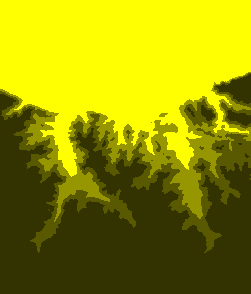
It happens that DTMs have been defined with elevation values of limited precision, which produces surfaces like here, notably with many flat zones:
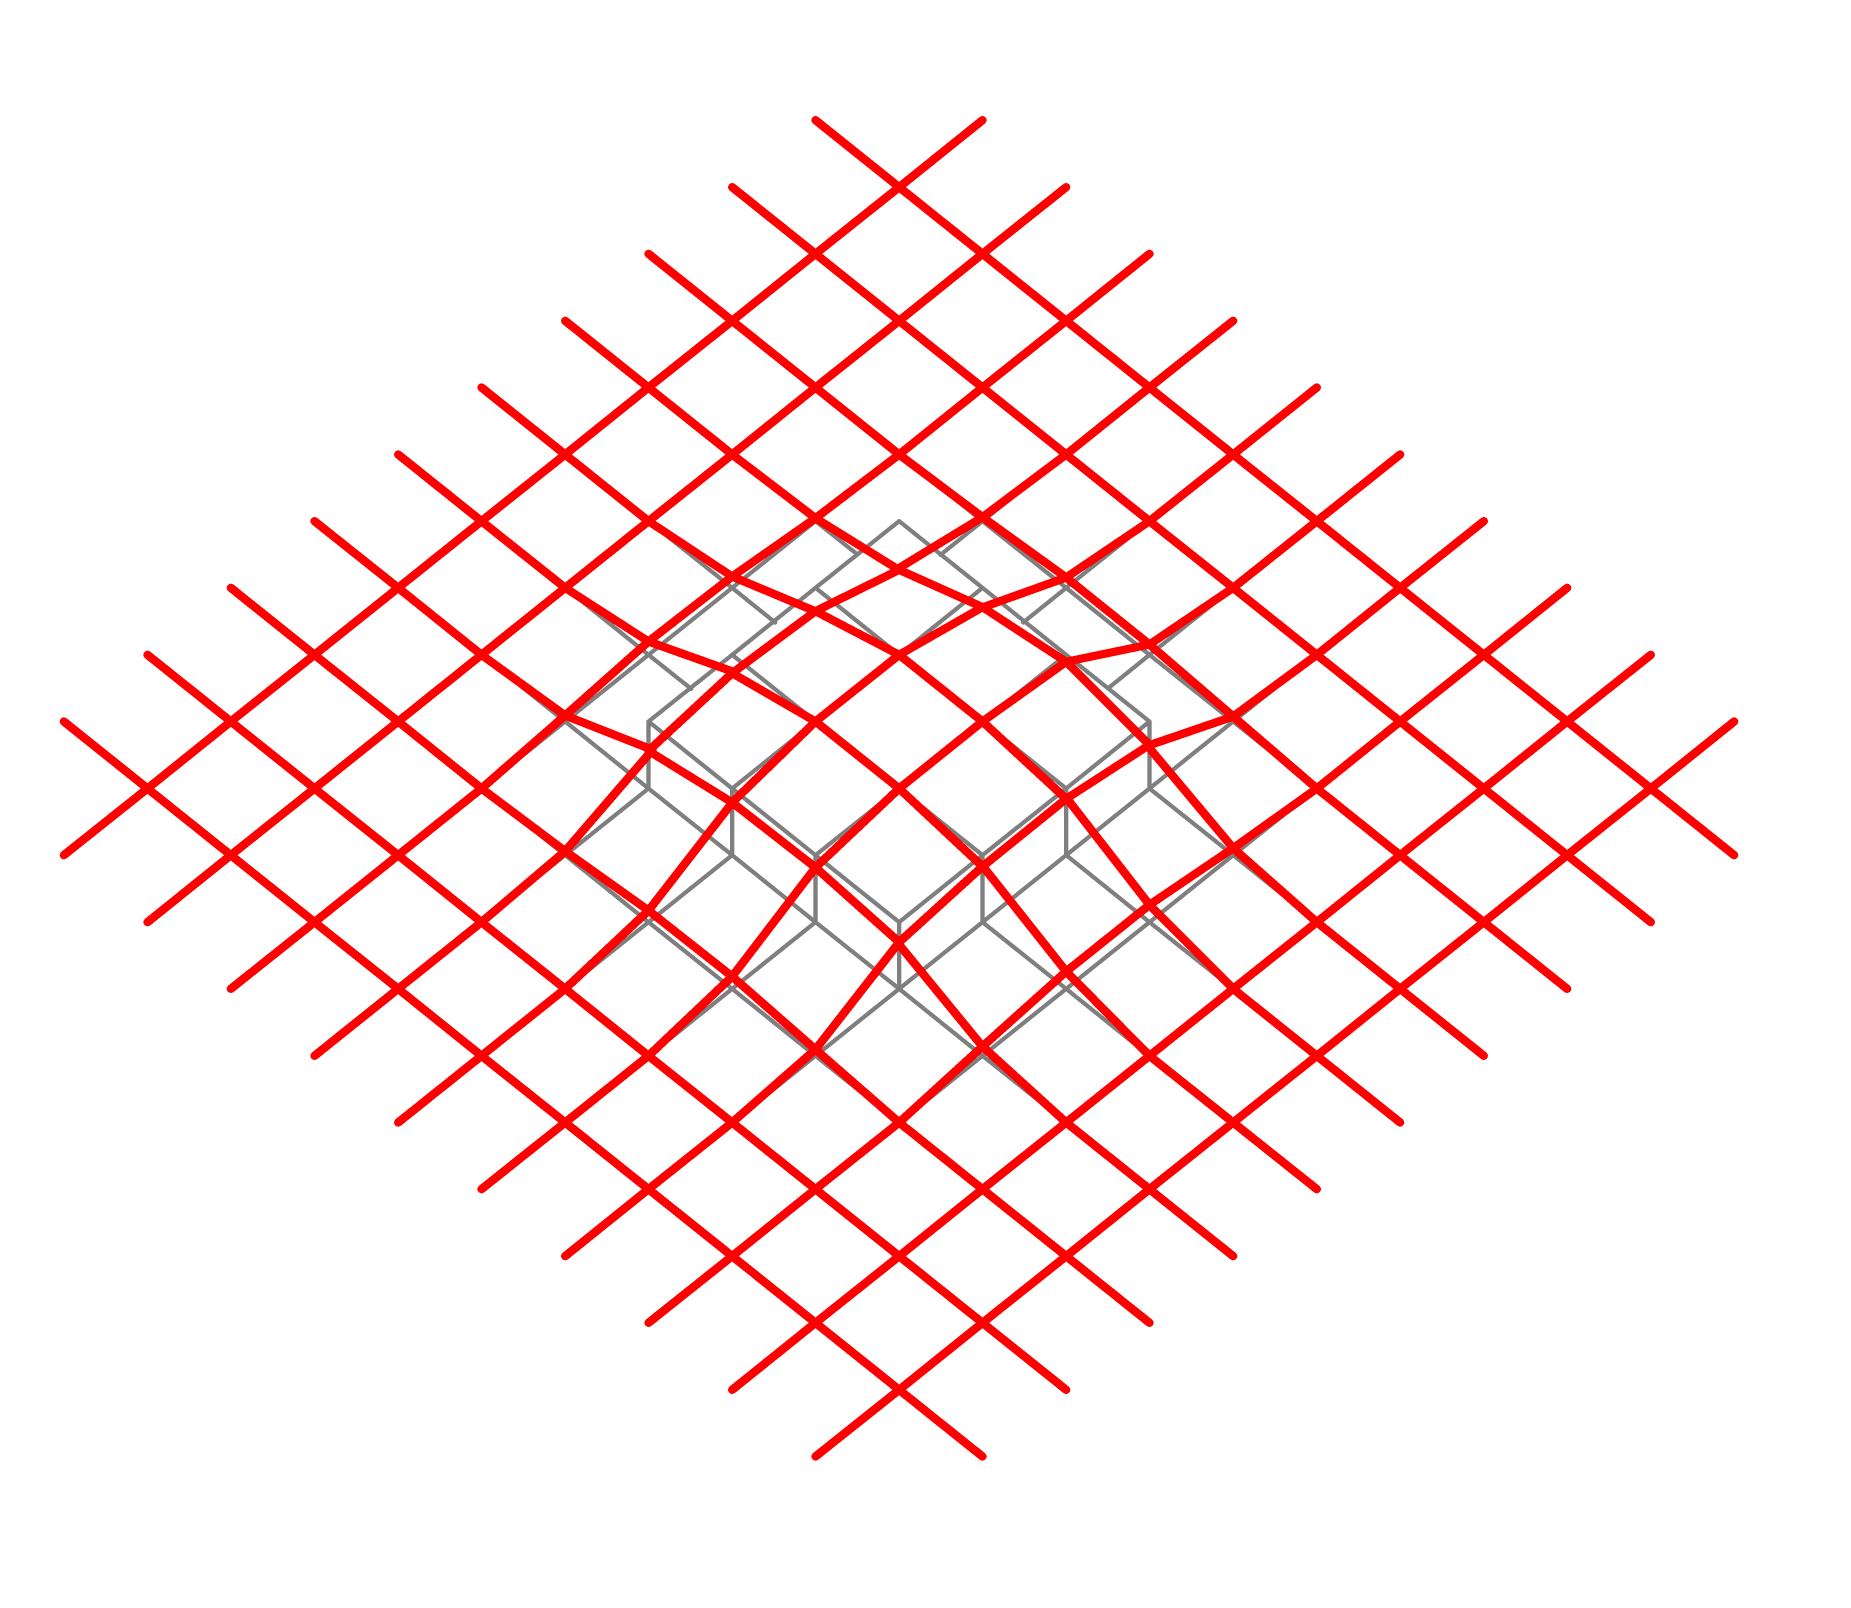
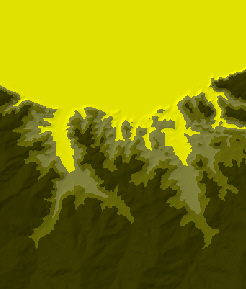
Smoothing consists of recalculating elevations at points based on those of their (to a certain extent) near neighbors. LorikGISTools allows defining this, according to the Gauss method, directly in the properties of the DTMs used, which produces in our example the following result:
Slope calculation
The tool will therefore need to determine this perpendicular at each point of the image. Several powerful features allow you to greatly improve the quality of the result.
Surface smoothing
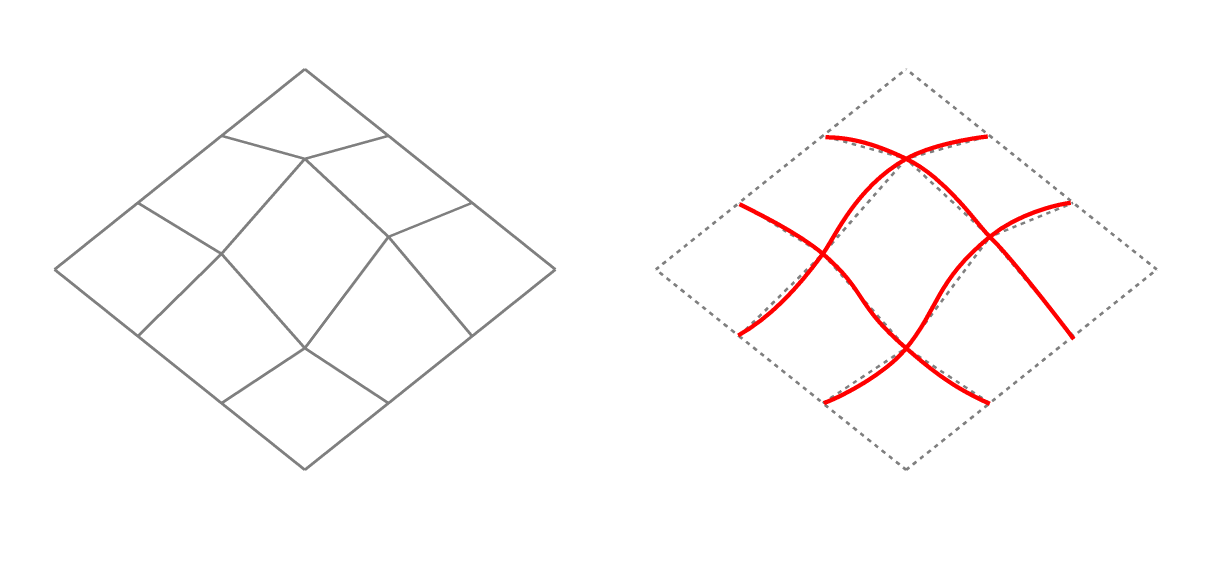
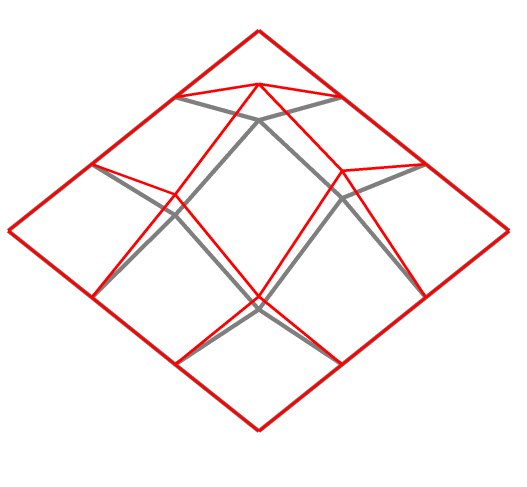
It is automatic and therefore requires no settings. It replaces the segments between points with curves calculated from neighboring points by bicubic interpolation, and so is able to compute the corresponding surface.
This allows converting a surface in the following way:
Following this preparation and thanks to its powerful algorithms, LorikGISTools knows how to calculate the perpendicular to this type of surface at each point in a very precise and much more realistic way, unlike the classic tools of other software.
Exaggeration
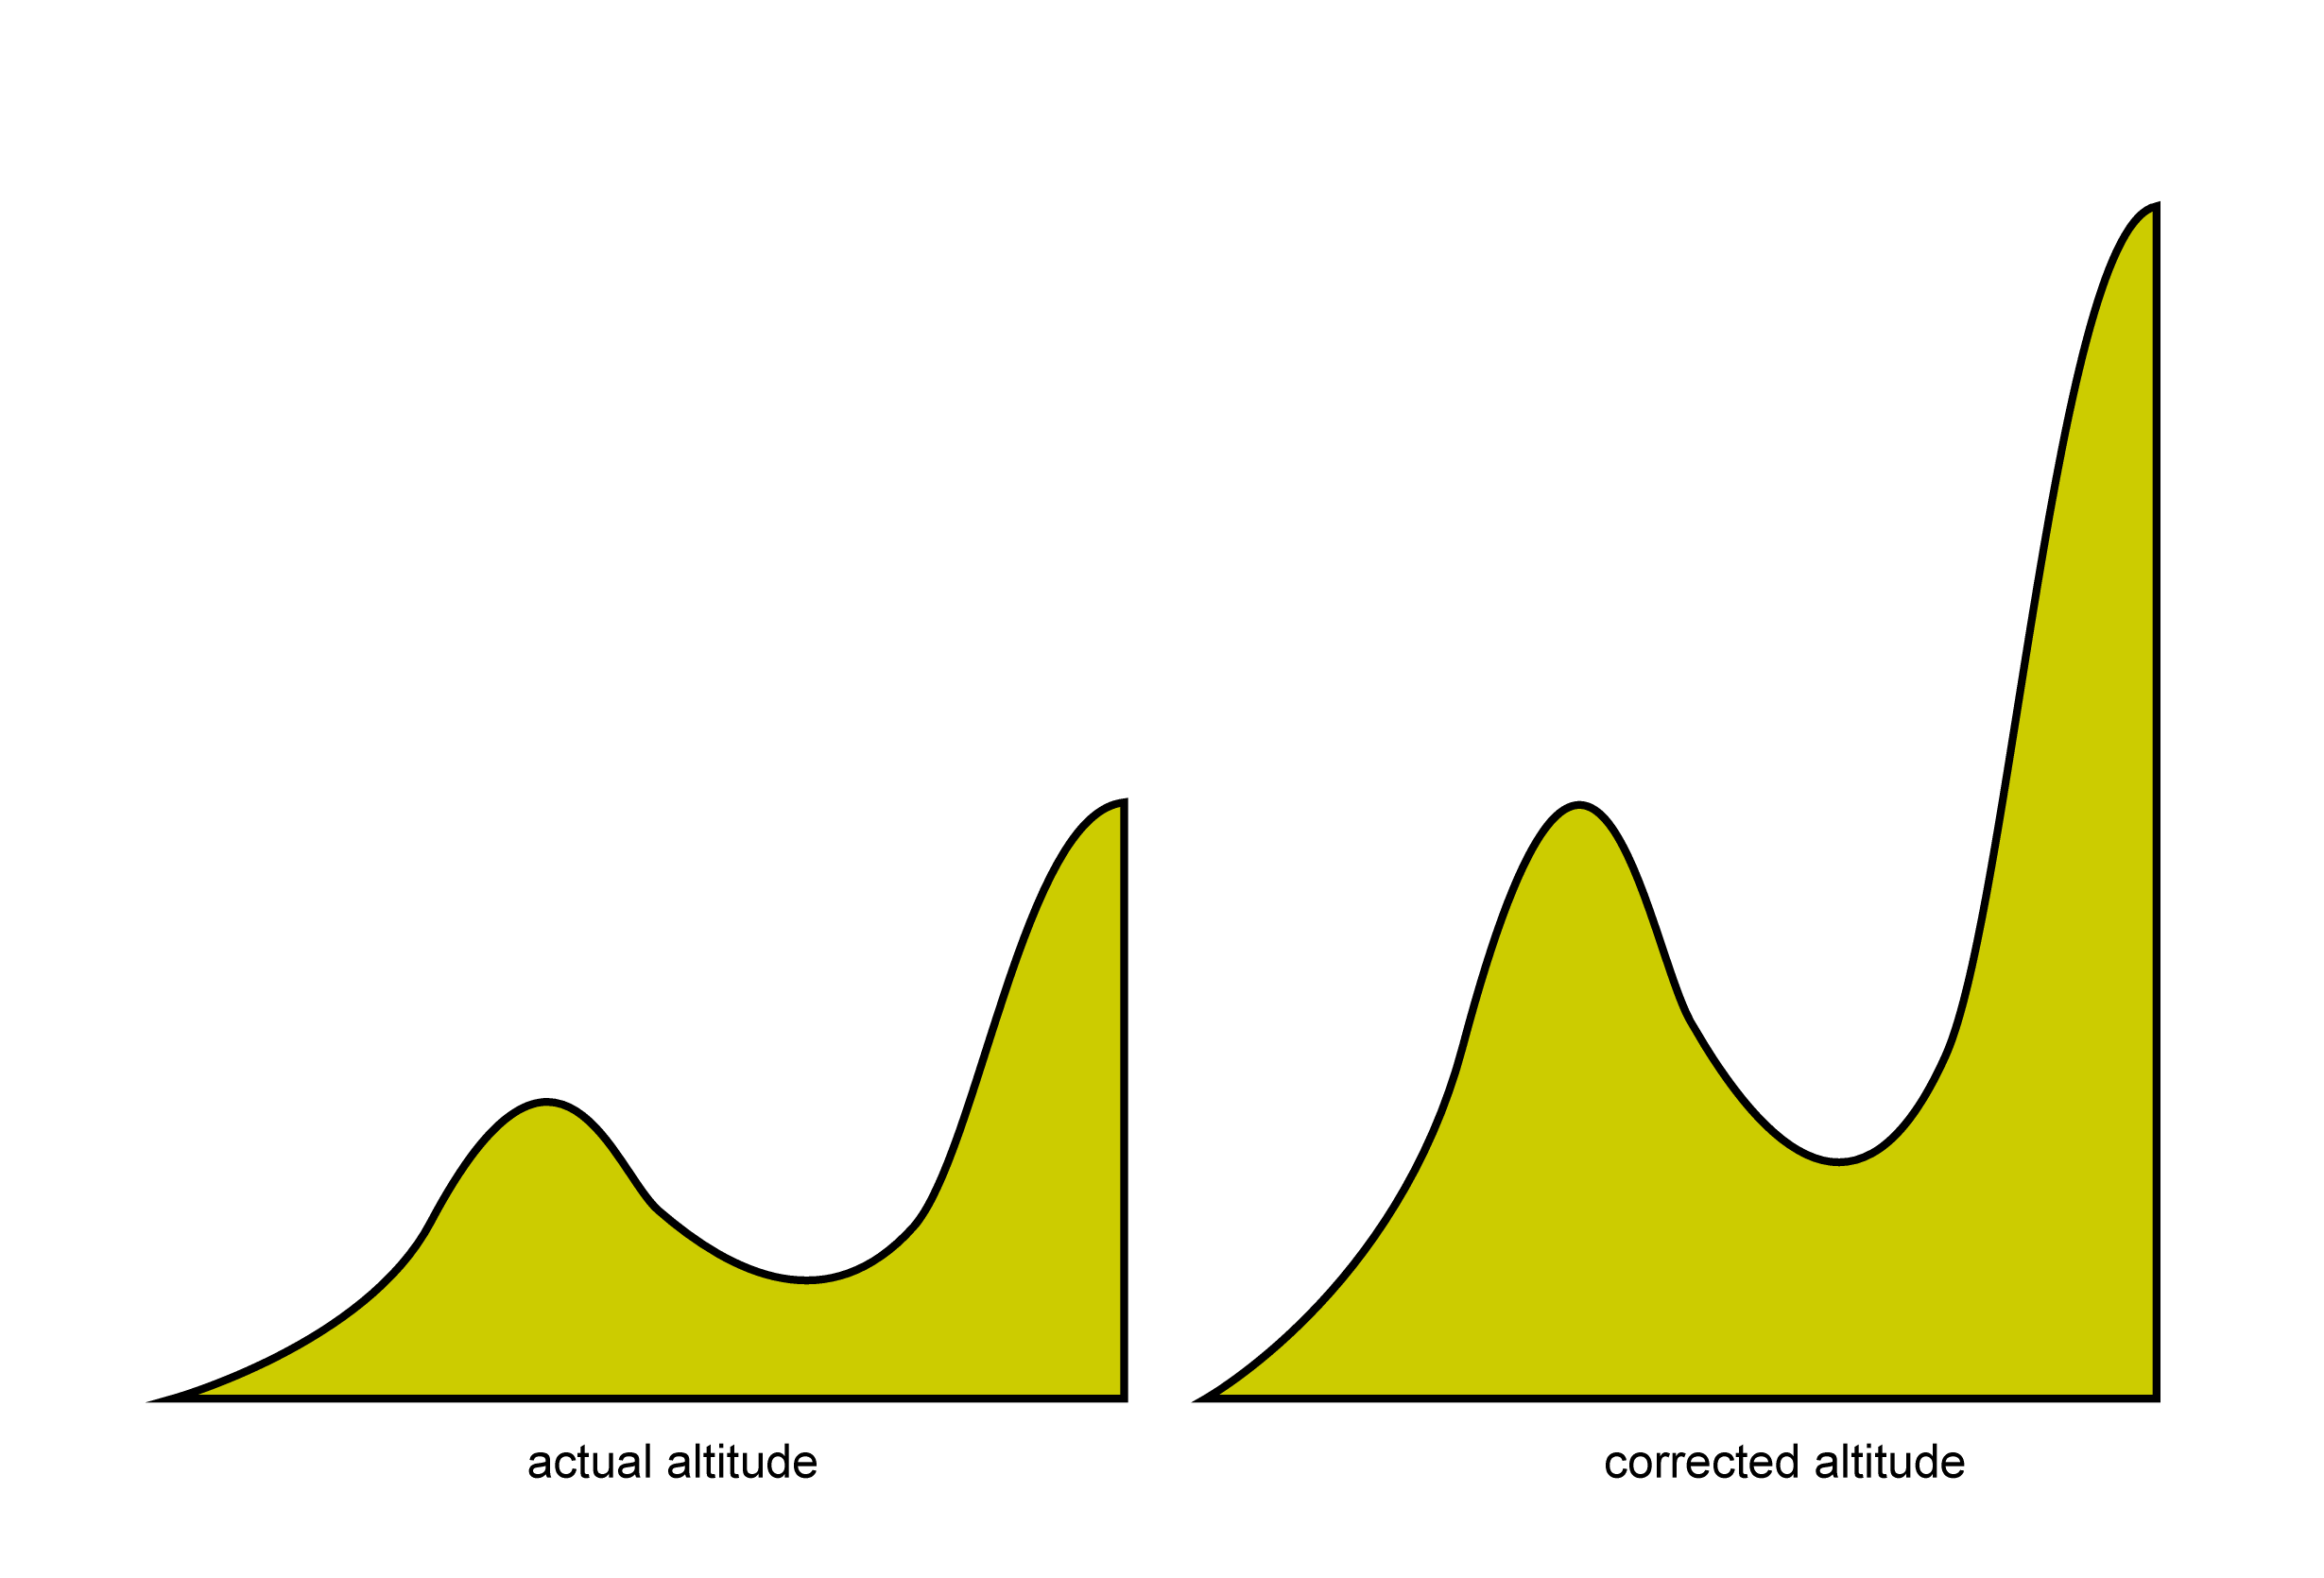
For low-relief terrain, brightness varies little from one point to another, making it difficult to highlight that relief. The commonly used solution is to set vertical exaggeration.
It is simply a multiplicative coefficient of altitude that allows accentuating slopes when computing brightness, and therefore increasing contrast, a principle shown here:
Final color choice
Again LorikGISTools offers all the possibilities you will need.
Colors are computed by elevation ranges and you can define as many ranges as desired. For a given range, for example between 100 and 200 metres, several methods are proposed:
Color depending only on brightness:
On any point of the image, the color does not depend on its elevation but only on its brightness. It is therefore only necessary to define the color for maximum brightness and that for minimum brightness. This is done in three possible ways:
Single color:
There is only one color for all brightness values, so the result only highlights the elevation ranges:
Brightness variation:
The calculated brightness of the point is used for the brightness of its color. You therefore only need to choose one color for maximum brightness:
Gradient:
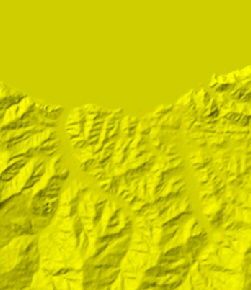
The color varies according to its brightness between two colors to be defined (here a single elevation range going from yellow to gray):
Color depending on the elevation:
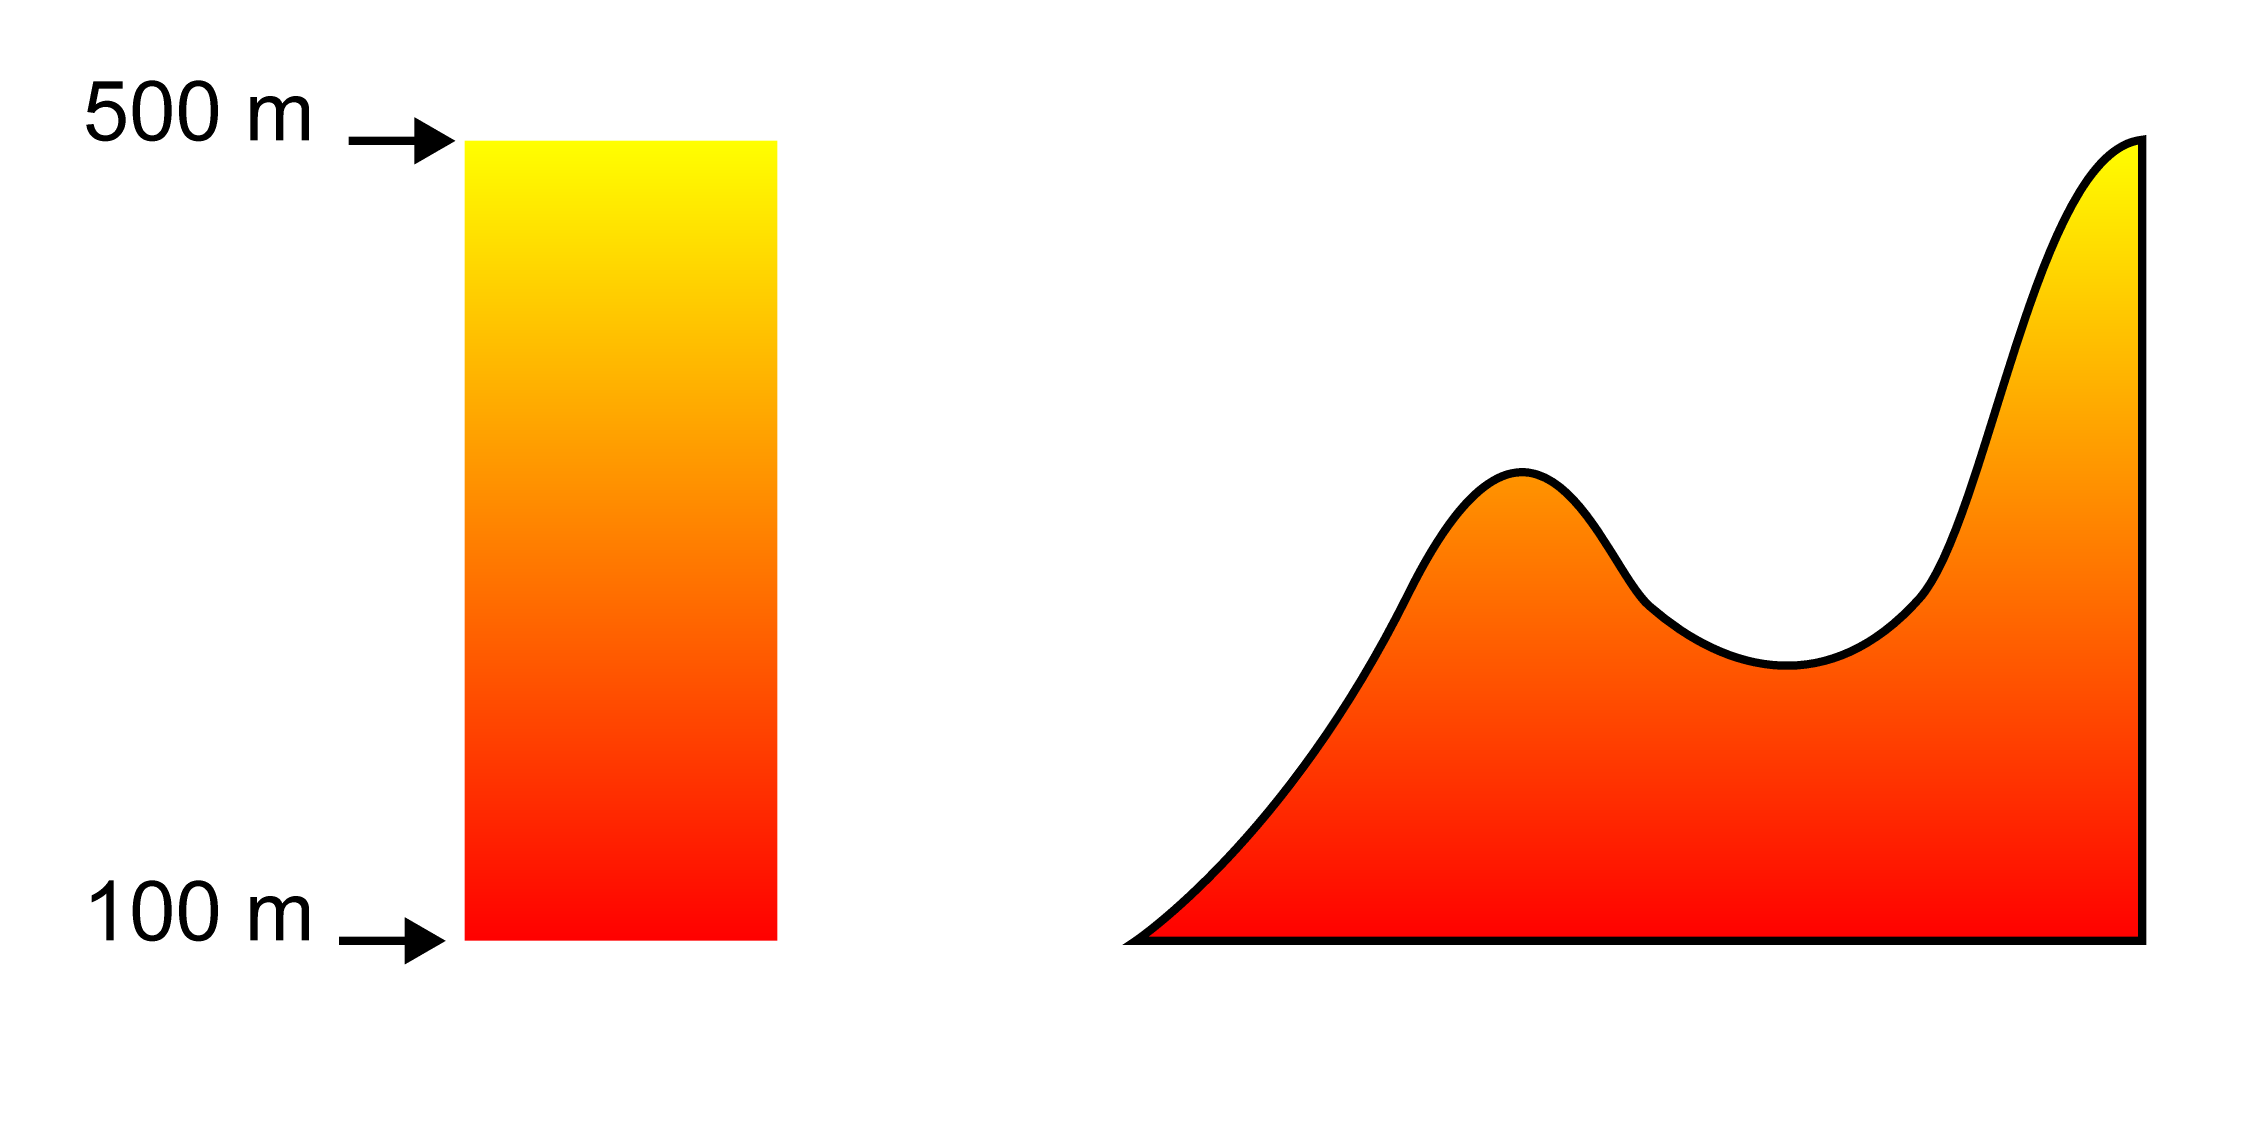
Much richer, this representation varies the color of a point of the image according to its elevation between two colors to be defined, as explained by this diagram:
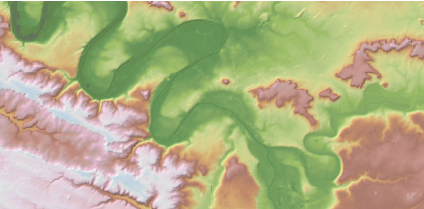
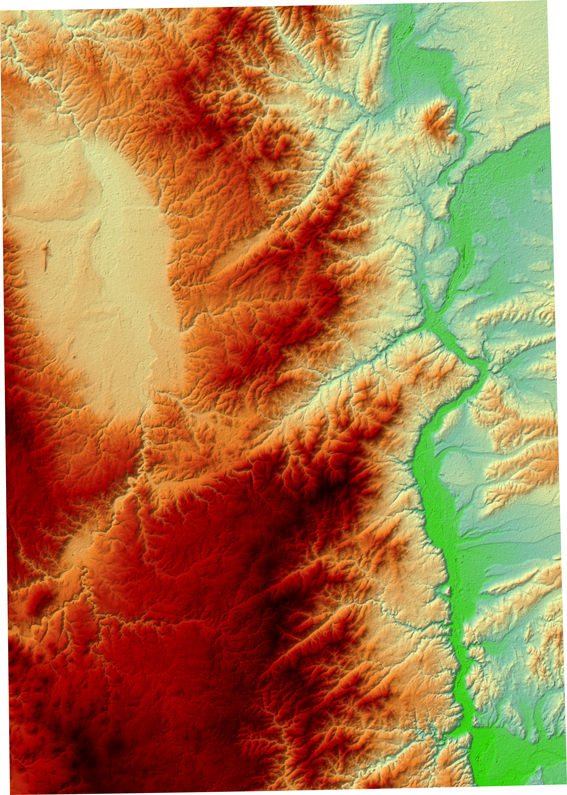
Then the color is attenuated according to brightness, which makes it possible to obtain this kind of result:
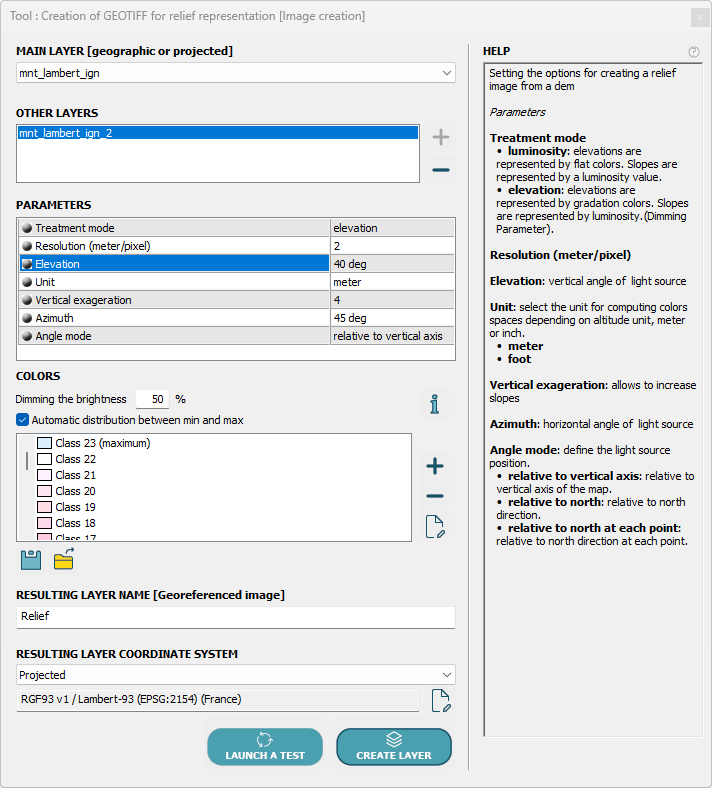
Presentation of the tool
DEM ⇒ Image Creation ⇒ Creation of GEOTIFF for relief representation.
Easy to use, it is presented as follows:
Start by choosing the layer containing a DTM.
Add, if needed, other layers containing adjacent DTMs, that is to say in the same georeferencing and aligned on the same grid.
Then you find the parameters:
Treatment mode, with two possible values:
- Brightness for colors depending only on brightness
- Elevation for colors also depending on elevation
Resolution, which allows indicating the number of meters represented by a pixel of the final image.
Unit, to choose between meter and foot for the definition of elevation ranges
Vertical exaggeration, as detailed earlier
Elevation, Azimuth and Angle mode for the light source
Then define your color ranges, specifying the attenuation percentage for the Elevation treating mode.
Note that you have the option to save or reload this configuration in an external file.
Finally, enter the name of the layer to create as well as its georeferencing.
The operation will create a new raster layer which can be exported to a file in GEOTIFF format.
