Dual View and Cartographic Comparison for Map Edition

• • •

What is Dual View and Comparison Mode?
How Does It Work in Practice?

Editing, Comparing, and Updating Maps

.Creating a cartographic representation can be achieved using various CAD tools such as Adobe Illustrator or GIS software like QGIS or ArcGIS. However, ensuring consistency across multiple scales or quickly retrieving relevant data from different sources while evolving your data is one of the many innovative features of the LorikSoftware suite.

The principle involves having a simultaneous and synchronized representation of your map and data for comparison.

Comparing Two LorikCartographer Documents

Simply add the second document to the “Document comparison” list of the first one.

The only limitation is that both documents must share the same projection, although they do not need to be at the same scale.

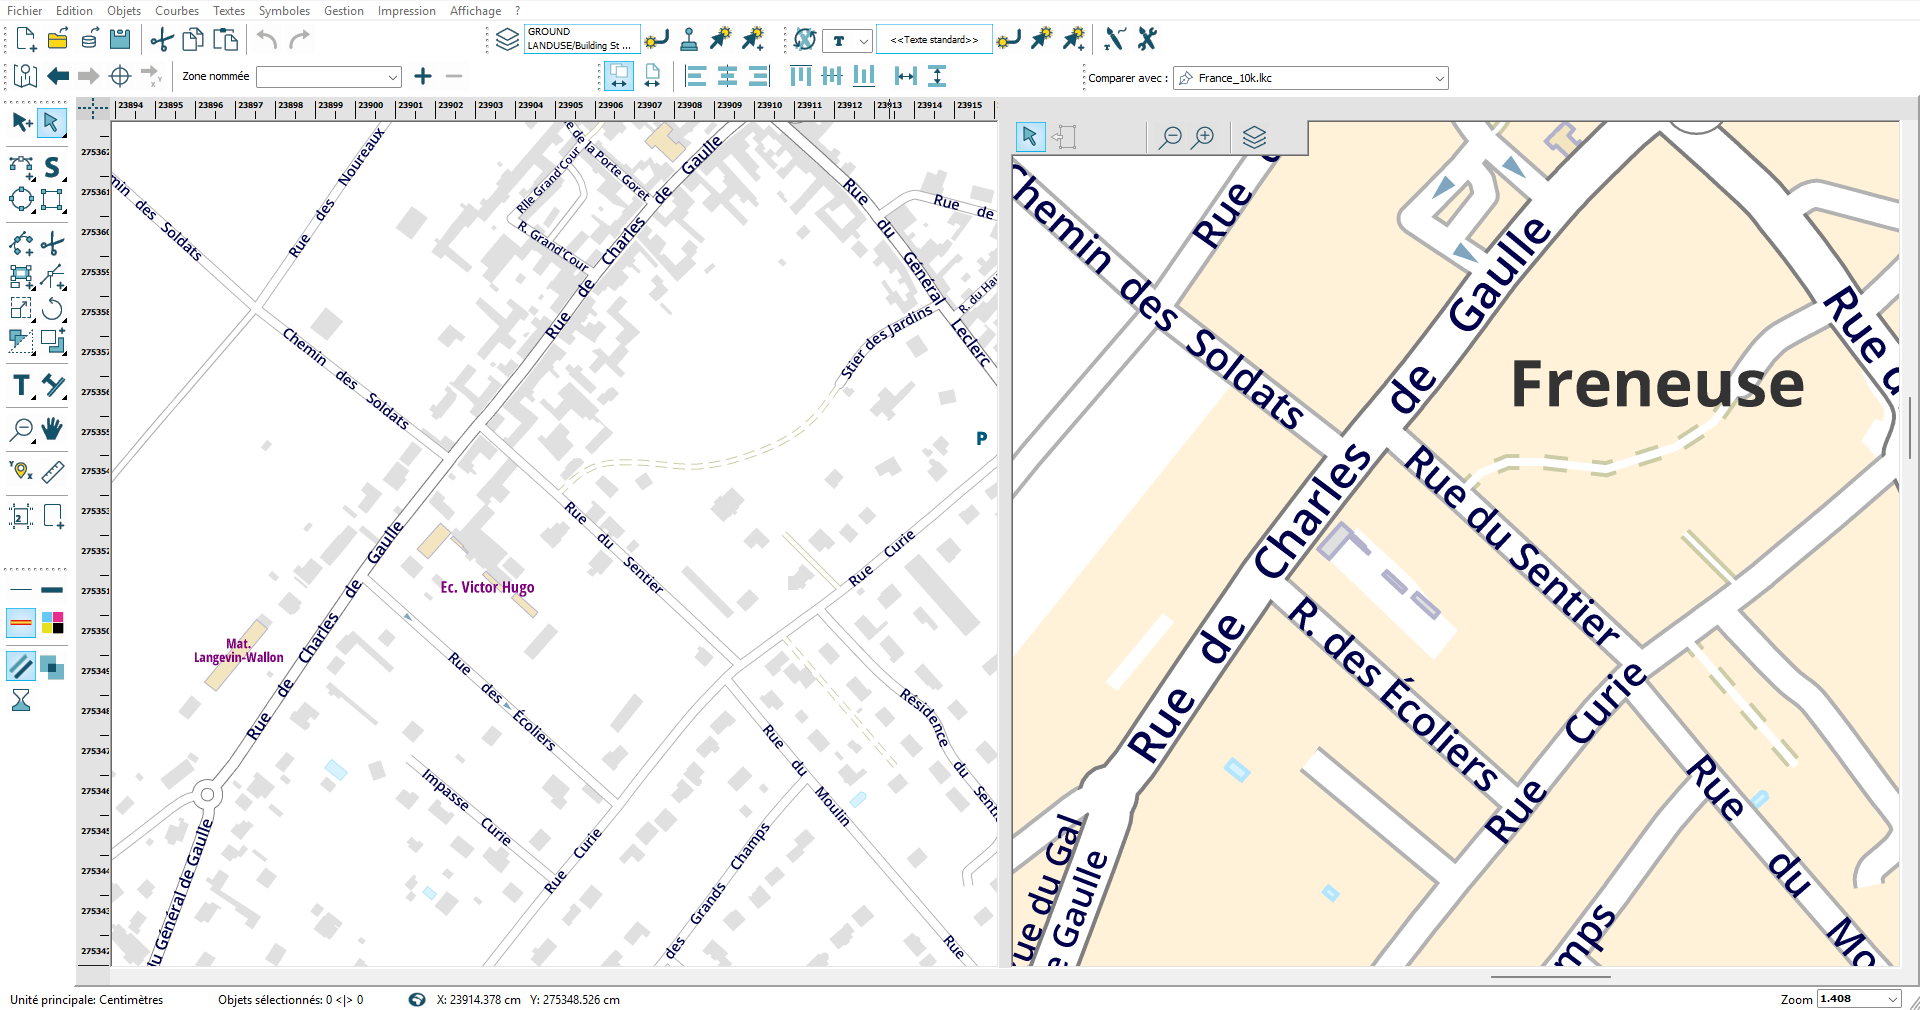
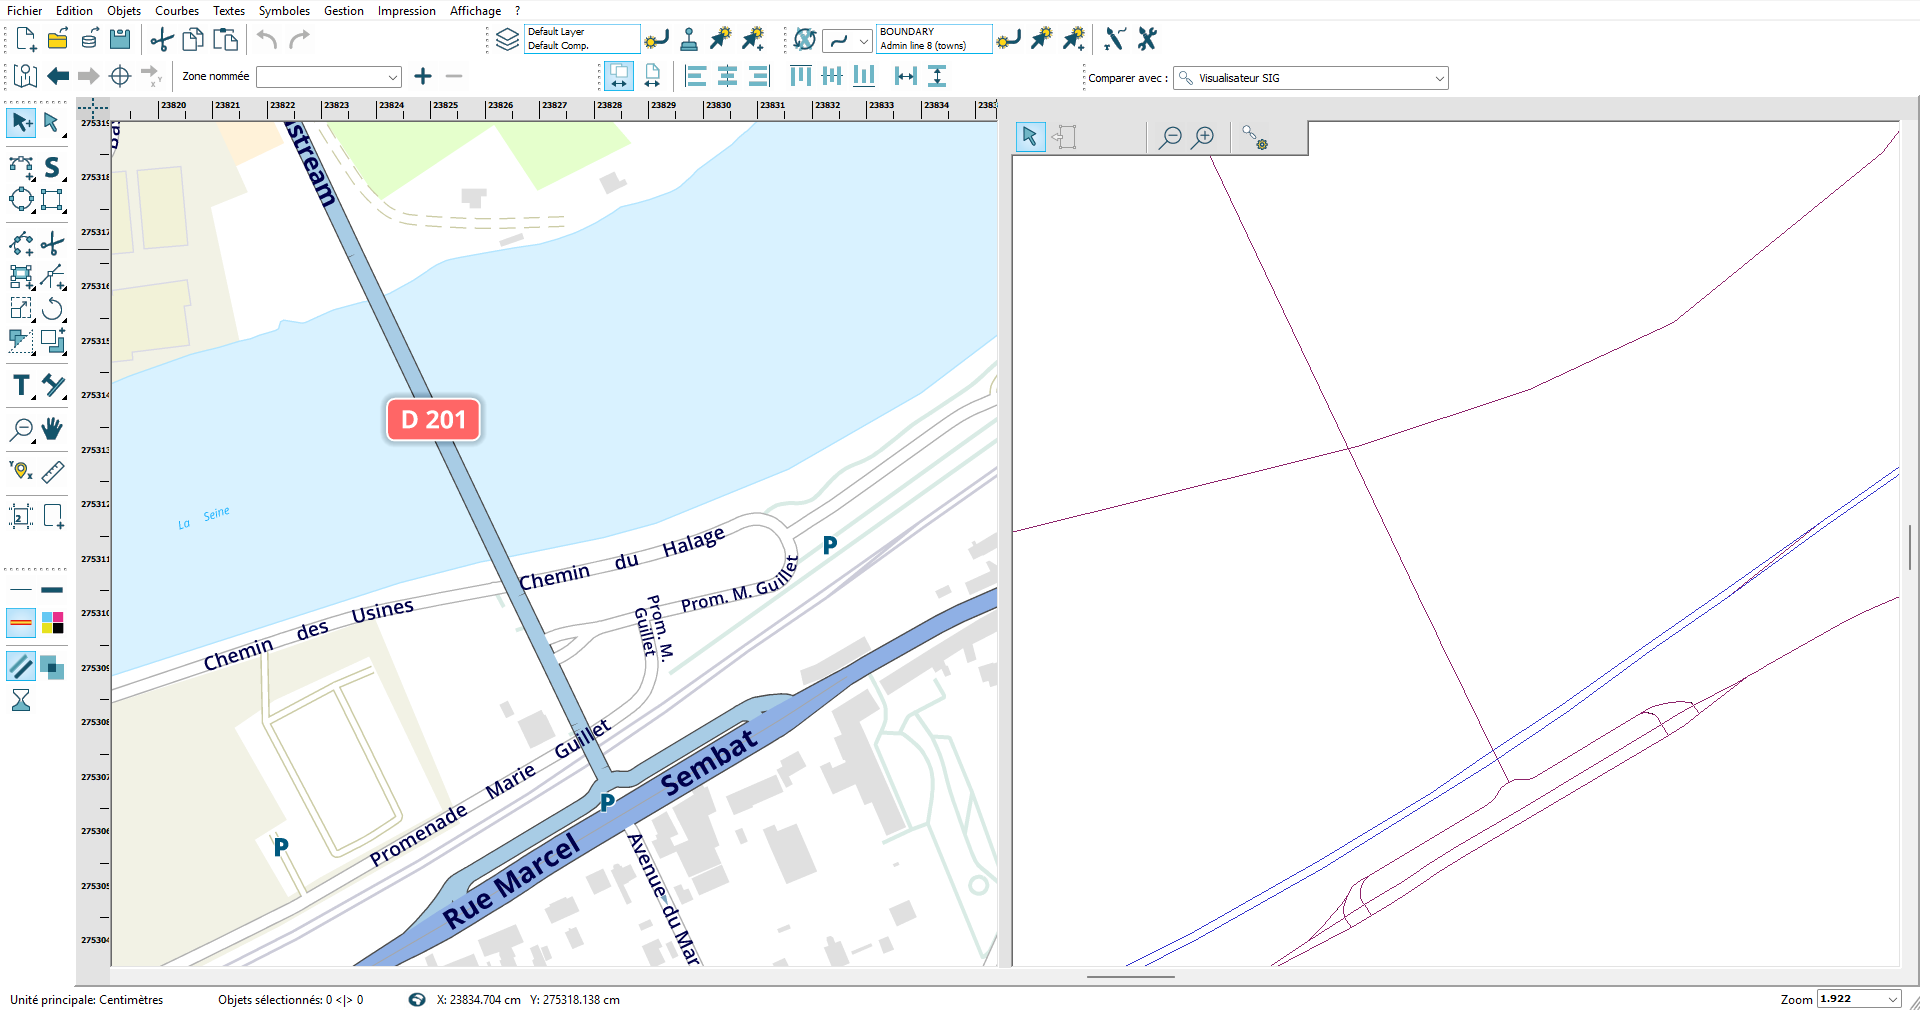
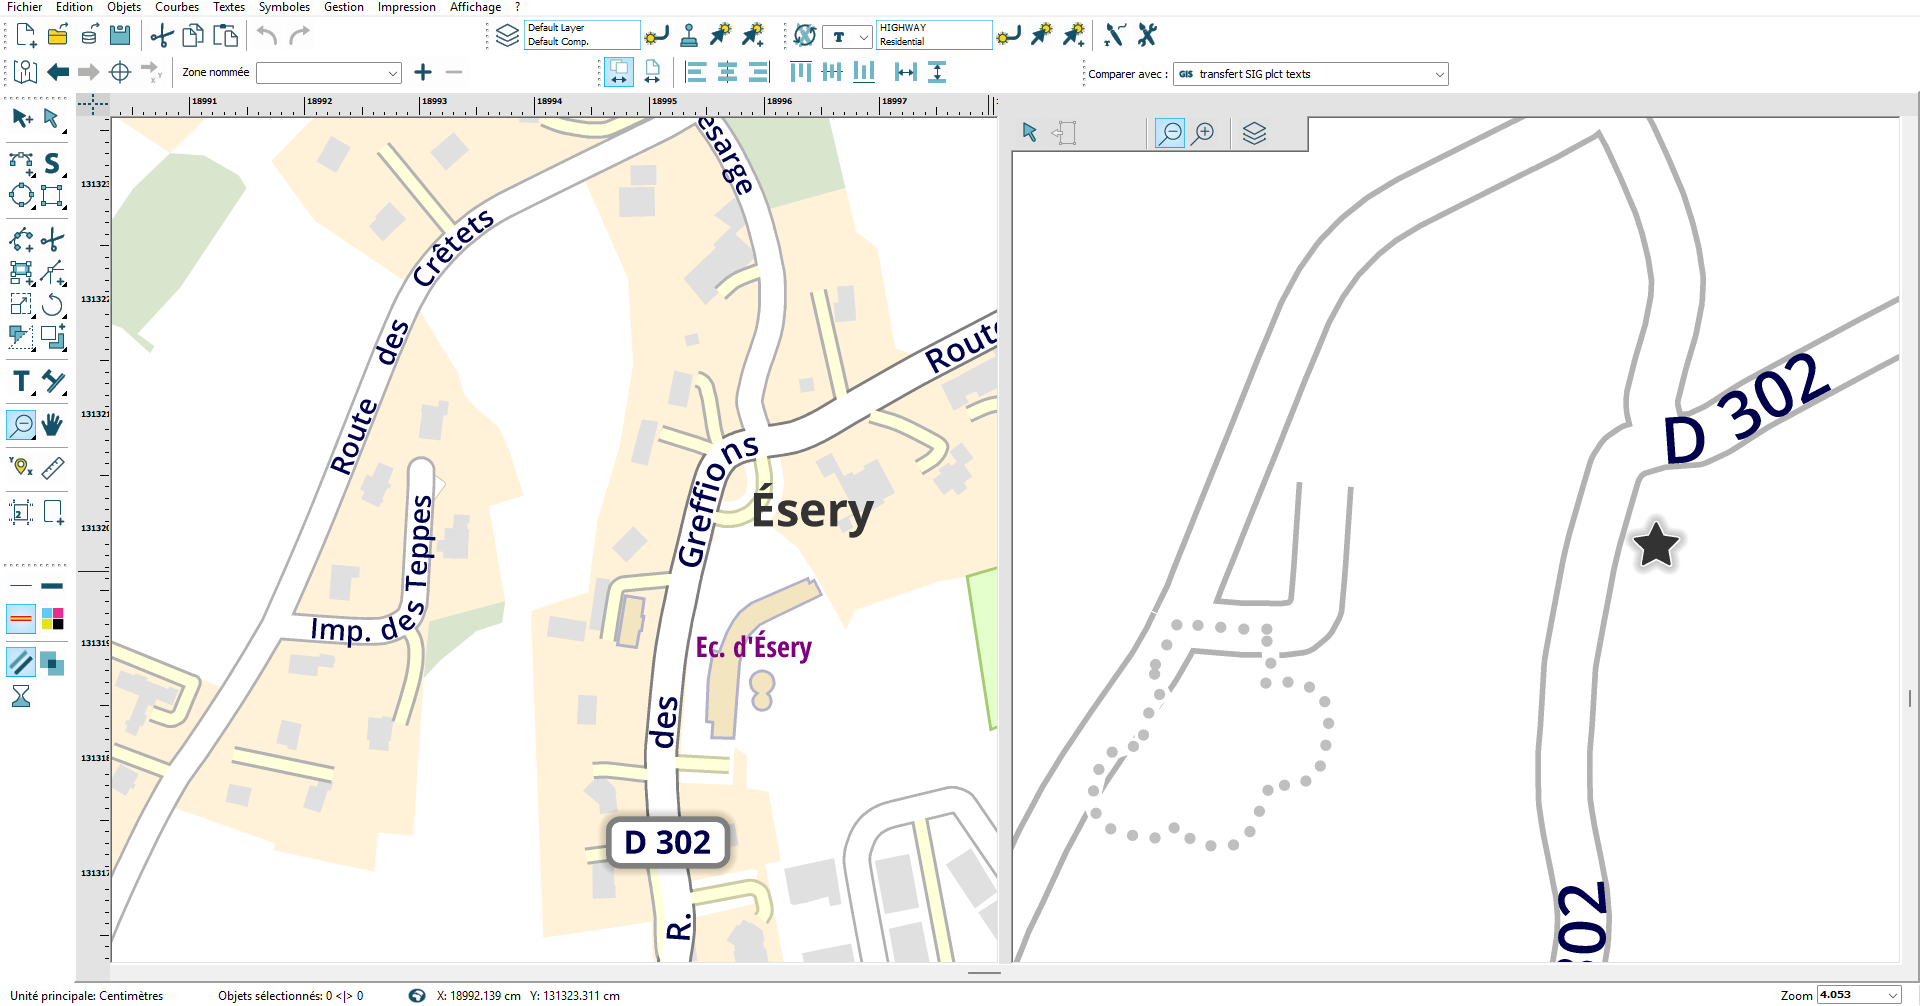
Activate the “dual view” mode, and the result displays your editing map on the left and the comparison document on the right.

Here is an example with a map at 1:2500 and a comparison map at 1:10000.

This allows the user to compare the two documents and make corrections to the document being edited.

Data Retrieval

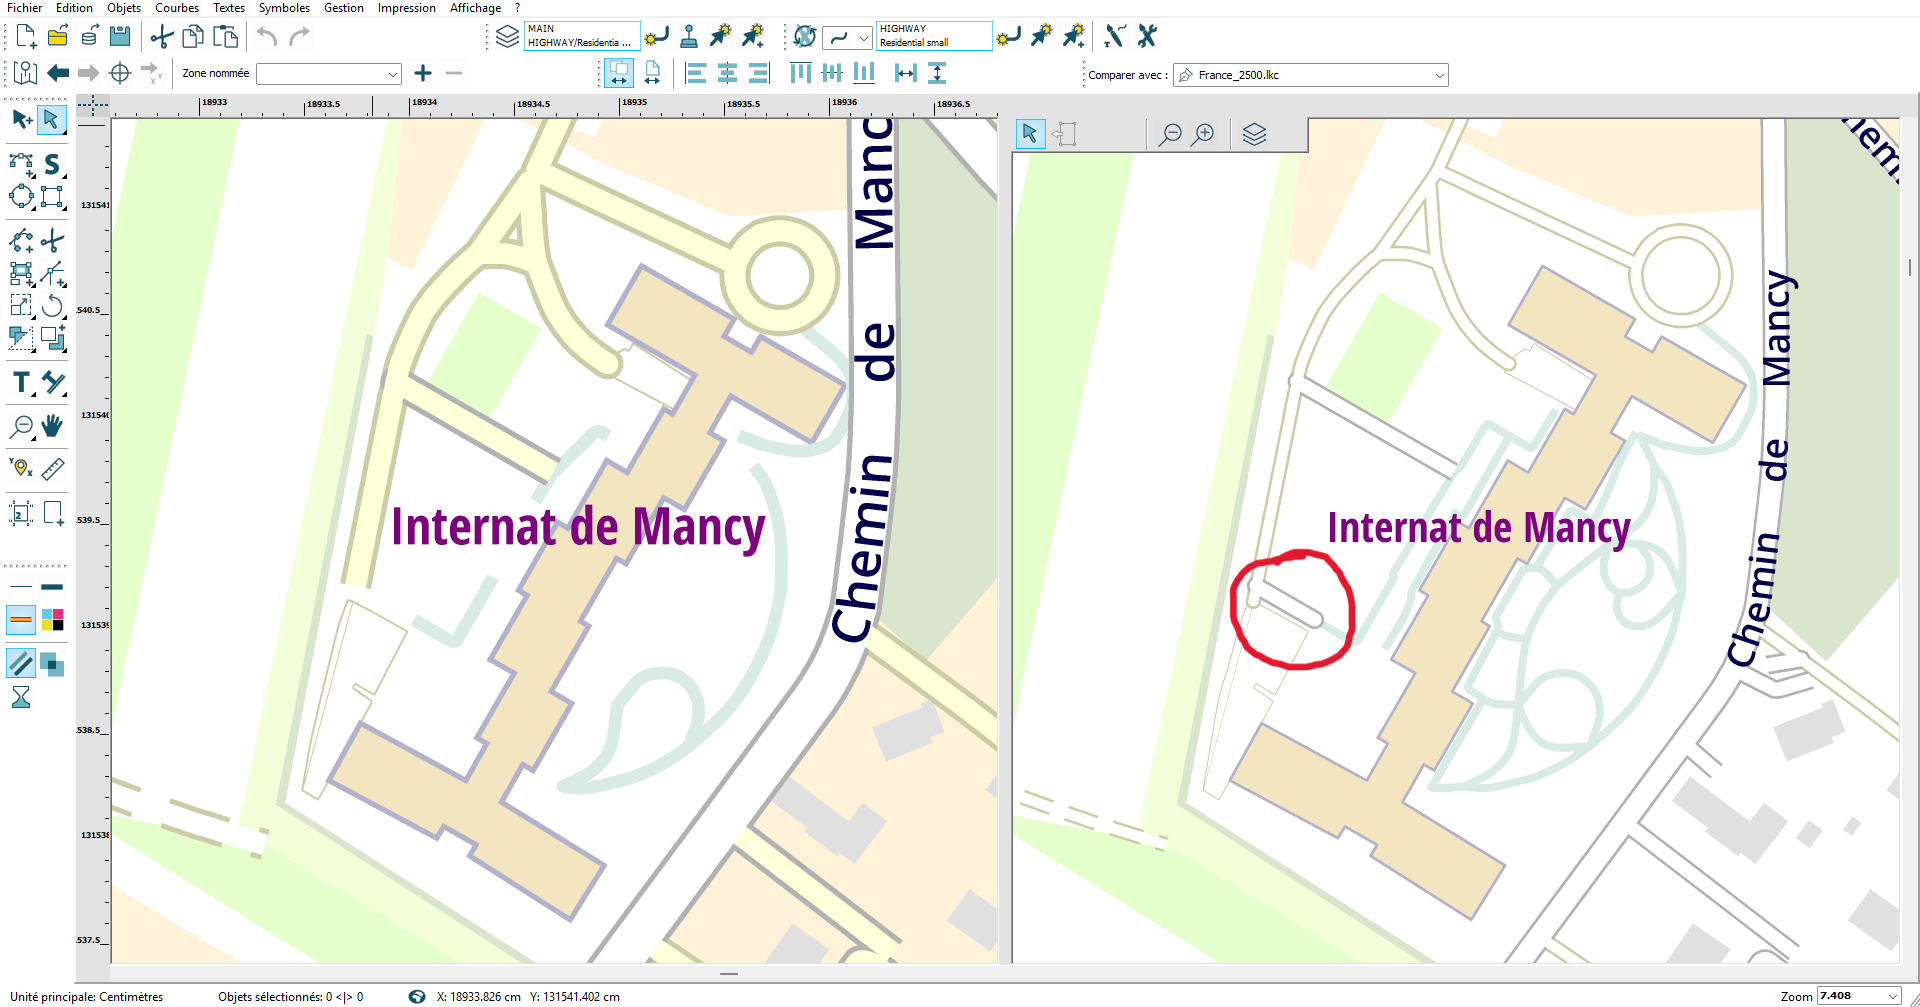
It is possible to extract entities from the comparison document using the symbology of the editing document (identified by name) and after scaling, as shown in the following example:

DSome curves from the comparison document do not have a counterpart in the editing document.

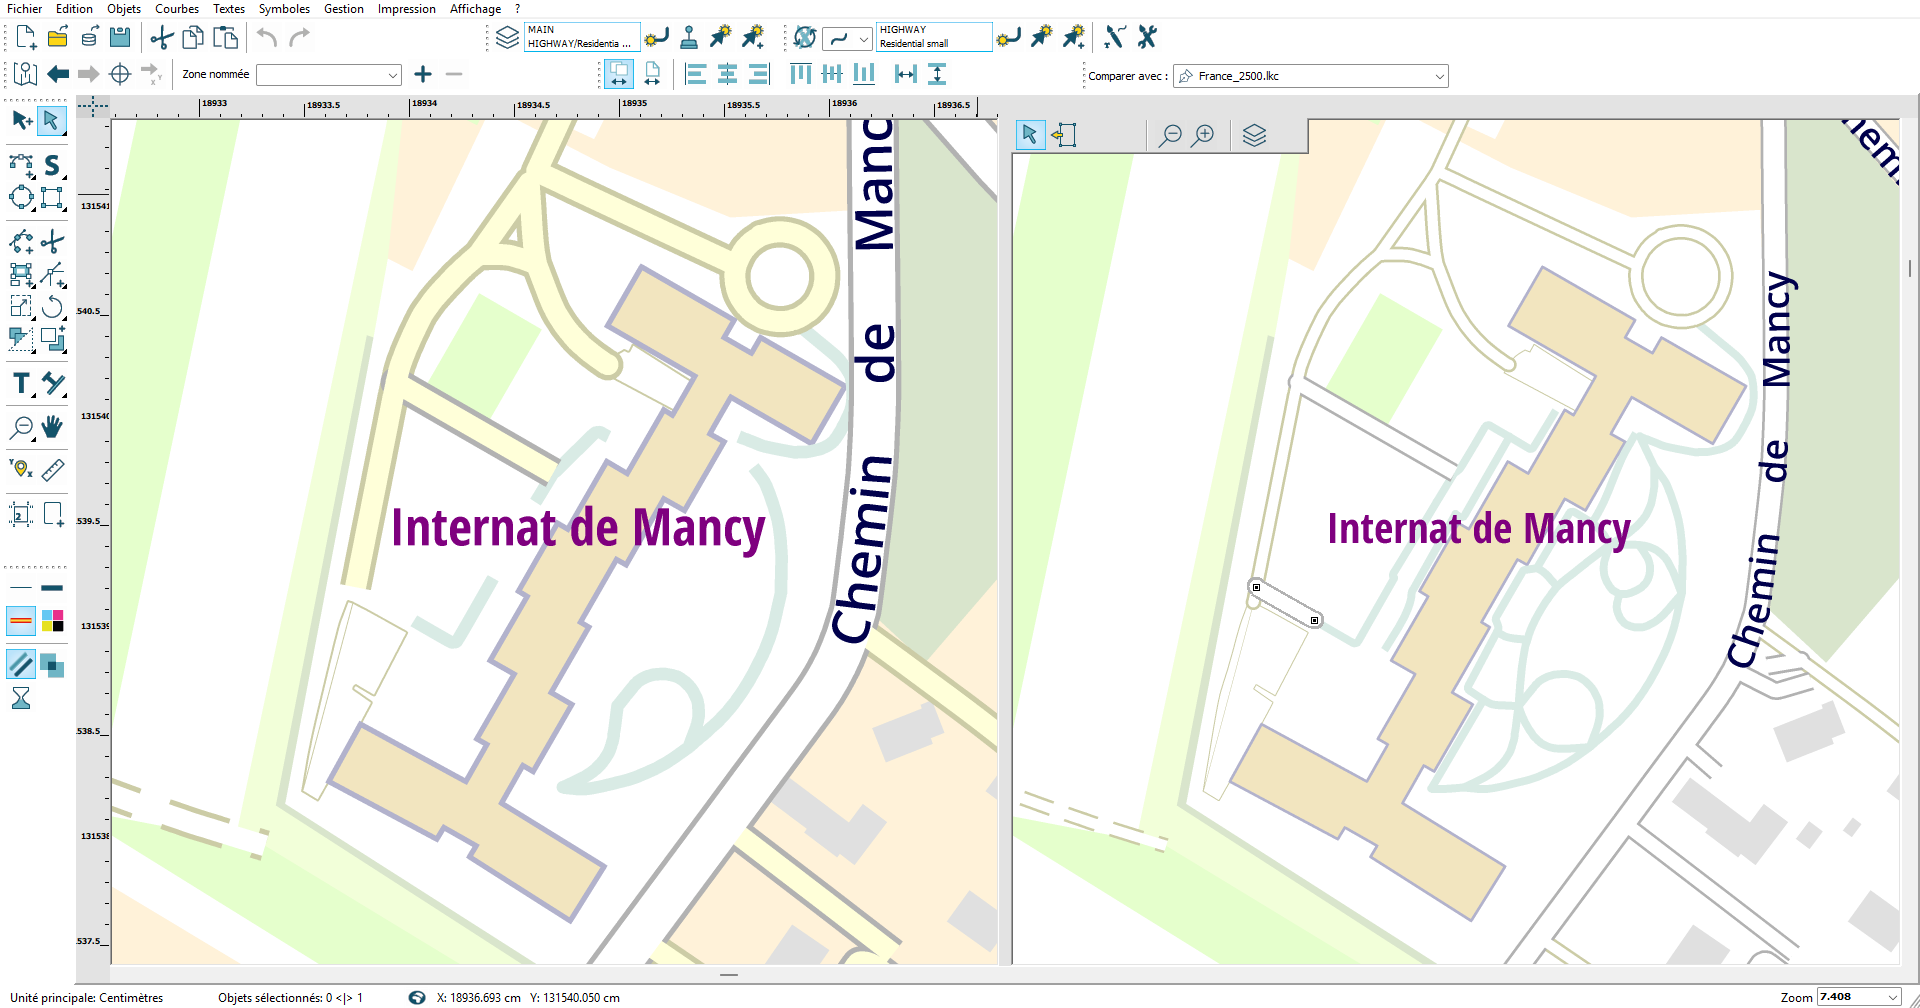
First Step: selection

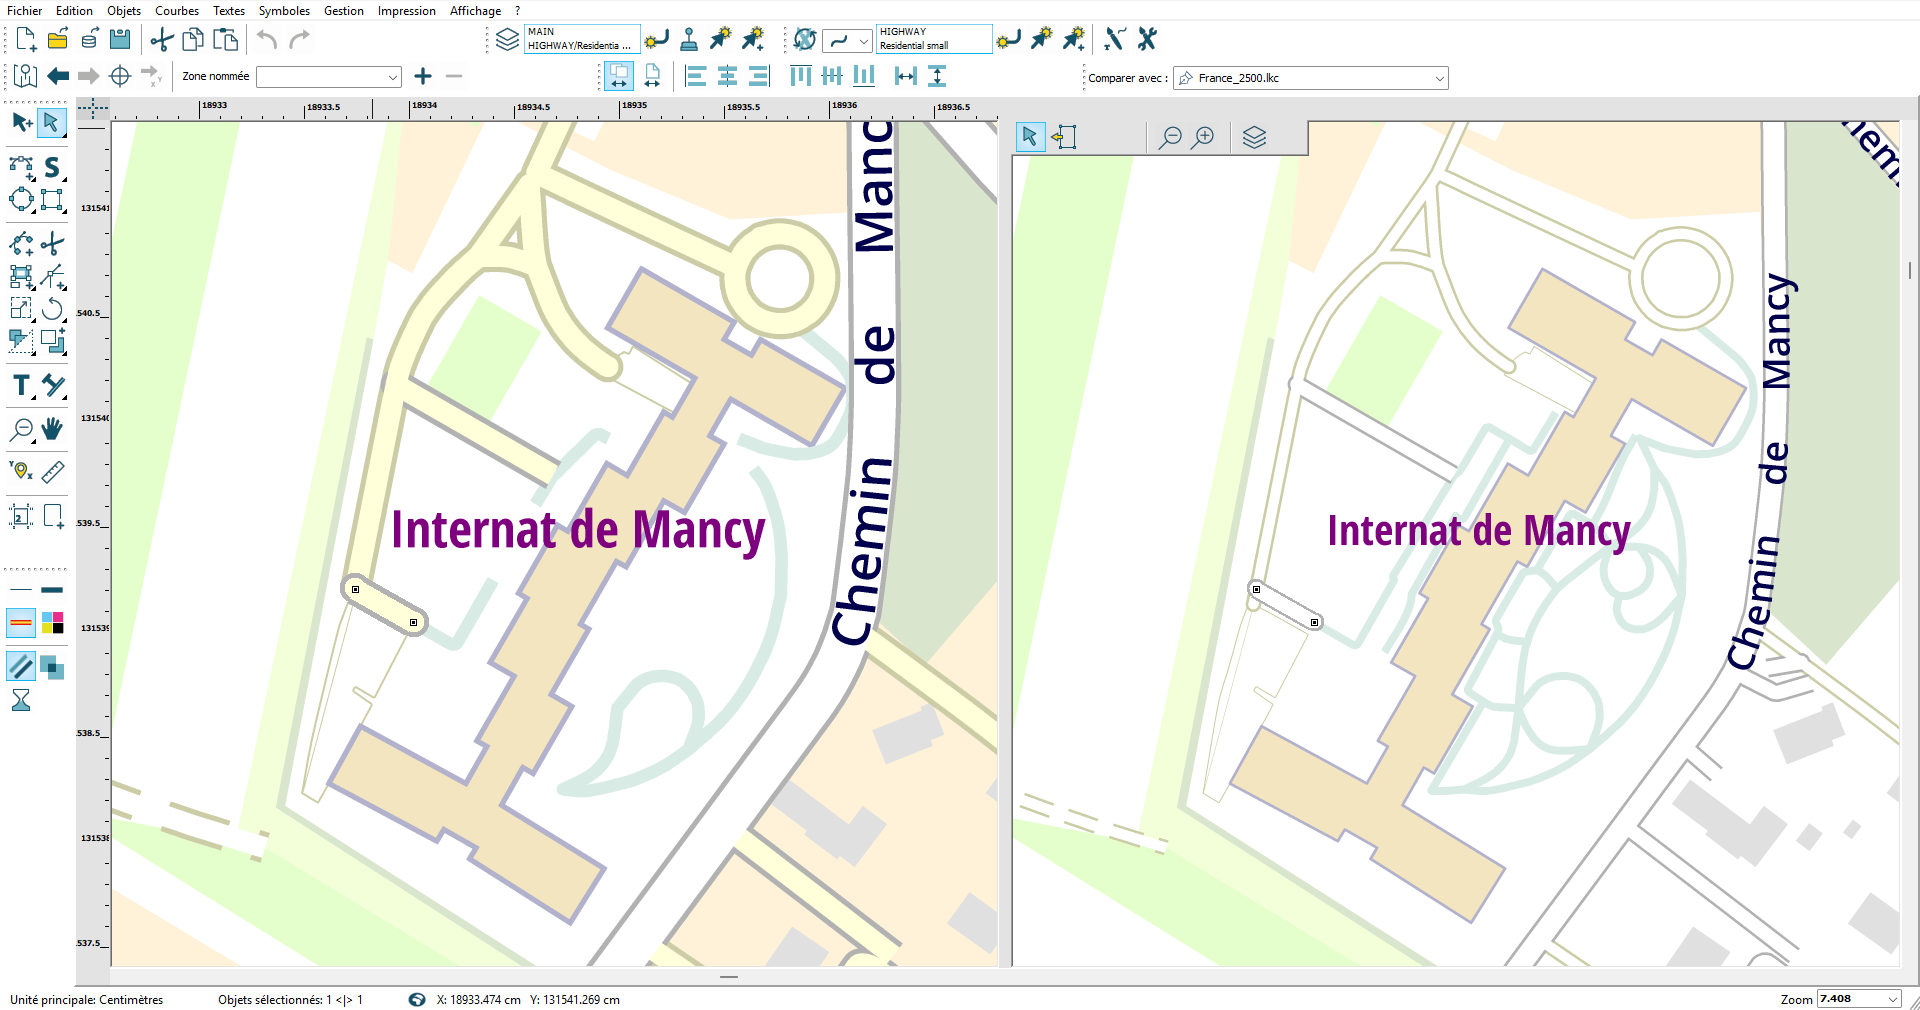
Second Step: copying to the editing document

The road is classified as “residential road,” and the corresponding symbology is different in the two documents.

Comparison with GIS Data

It is also possible to compare the document with data in major GIS formats or directly read from GIS databases (Postgres/PostGIS, Oracle) in any coordinate system.

This data is reprojected within the georeferencing of the editing document to ensure display synchronization.

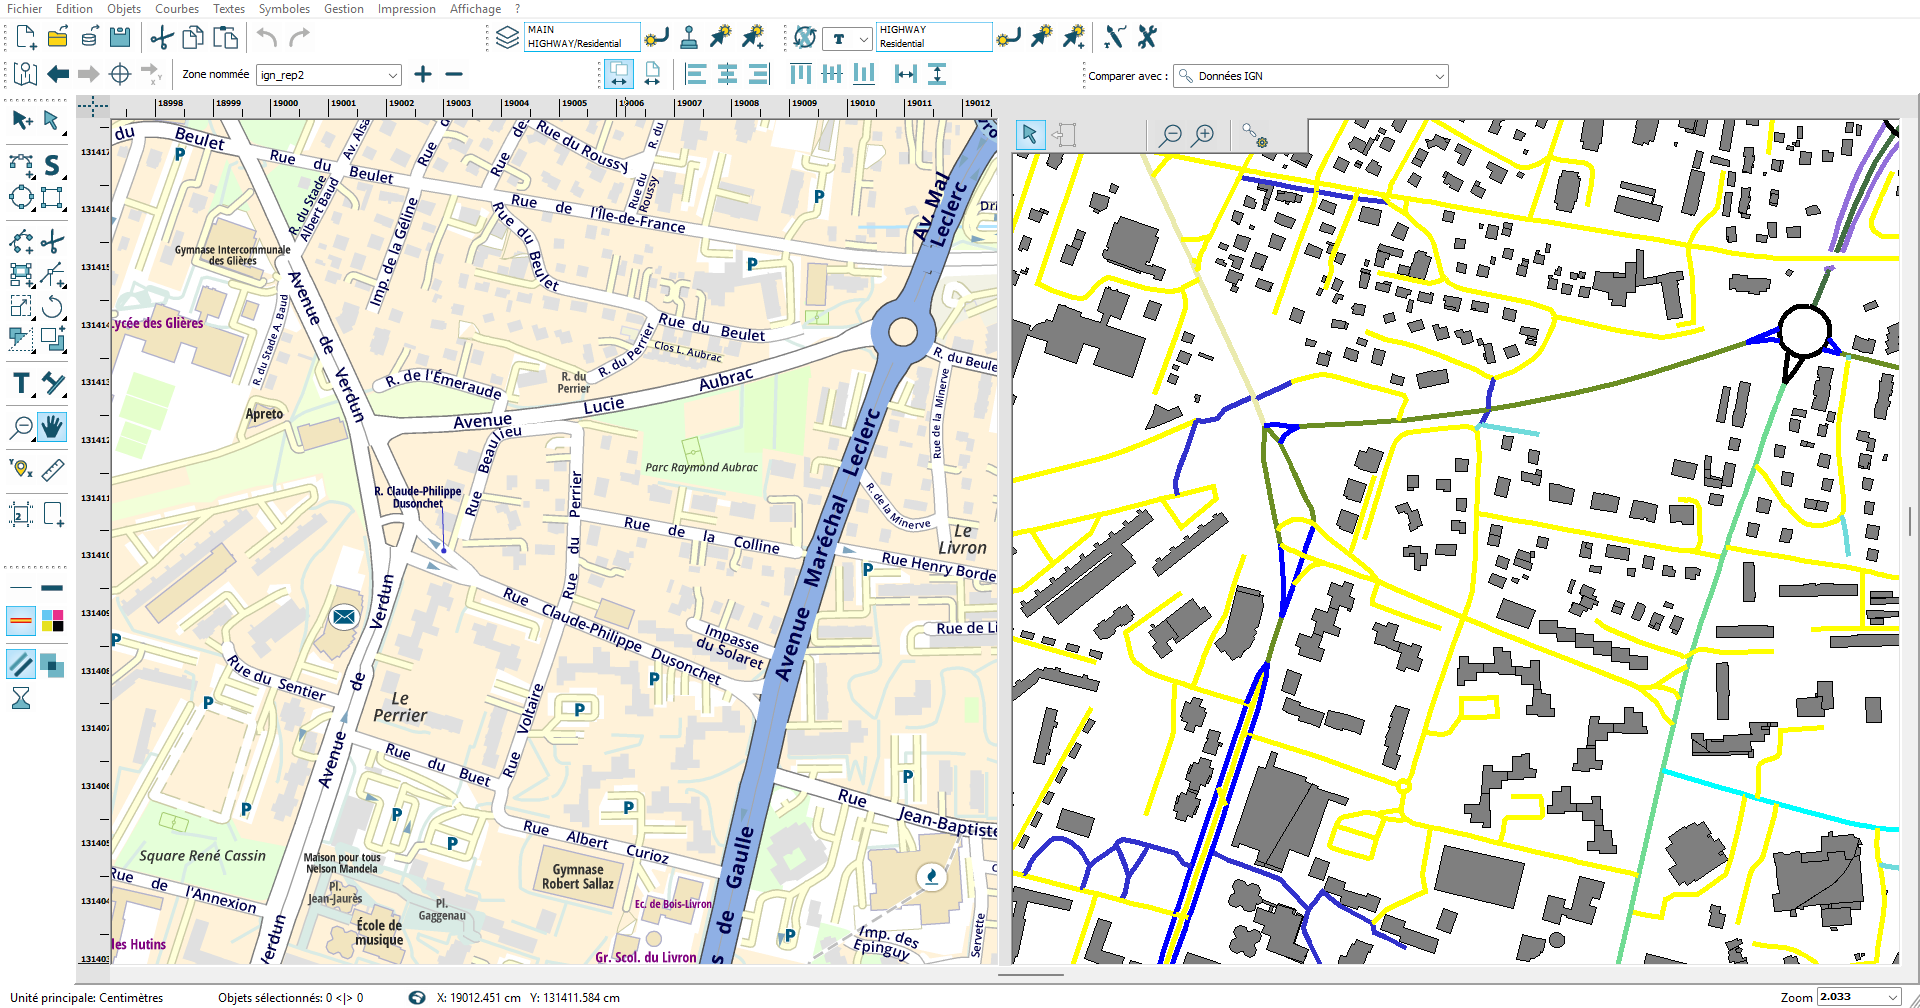
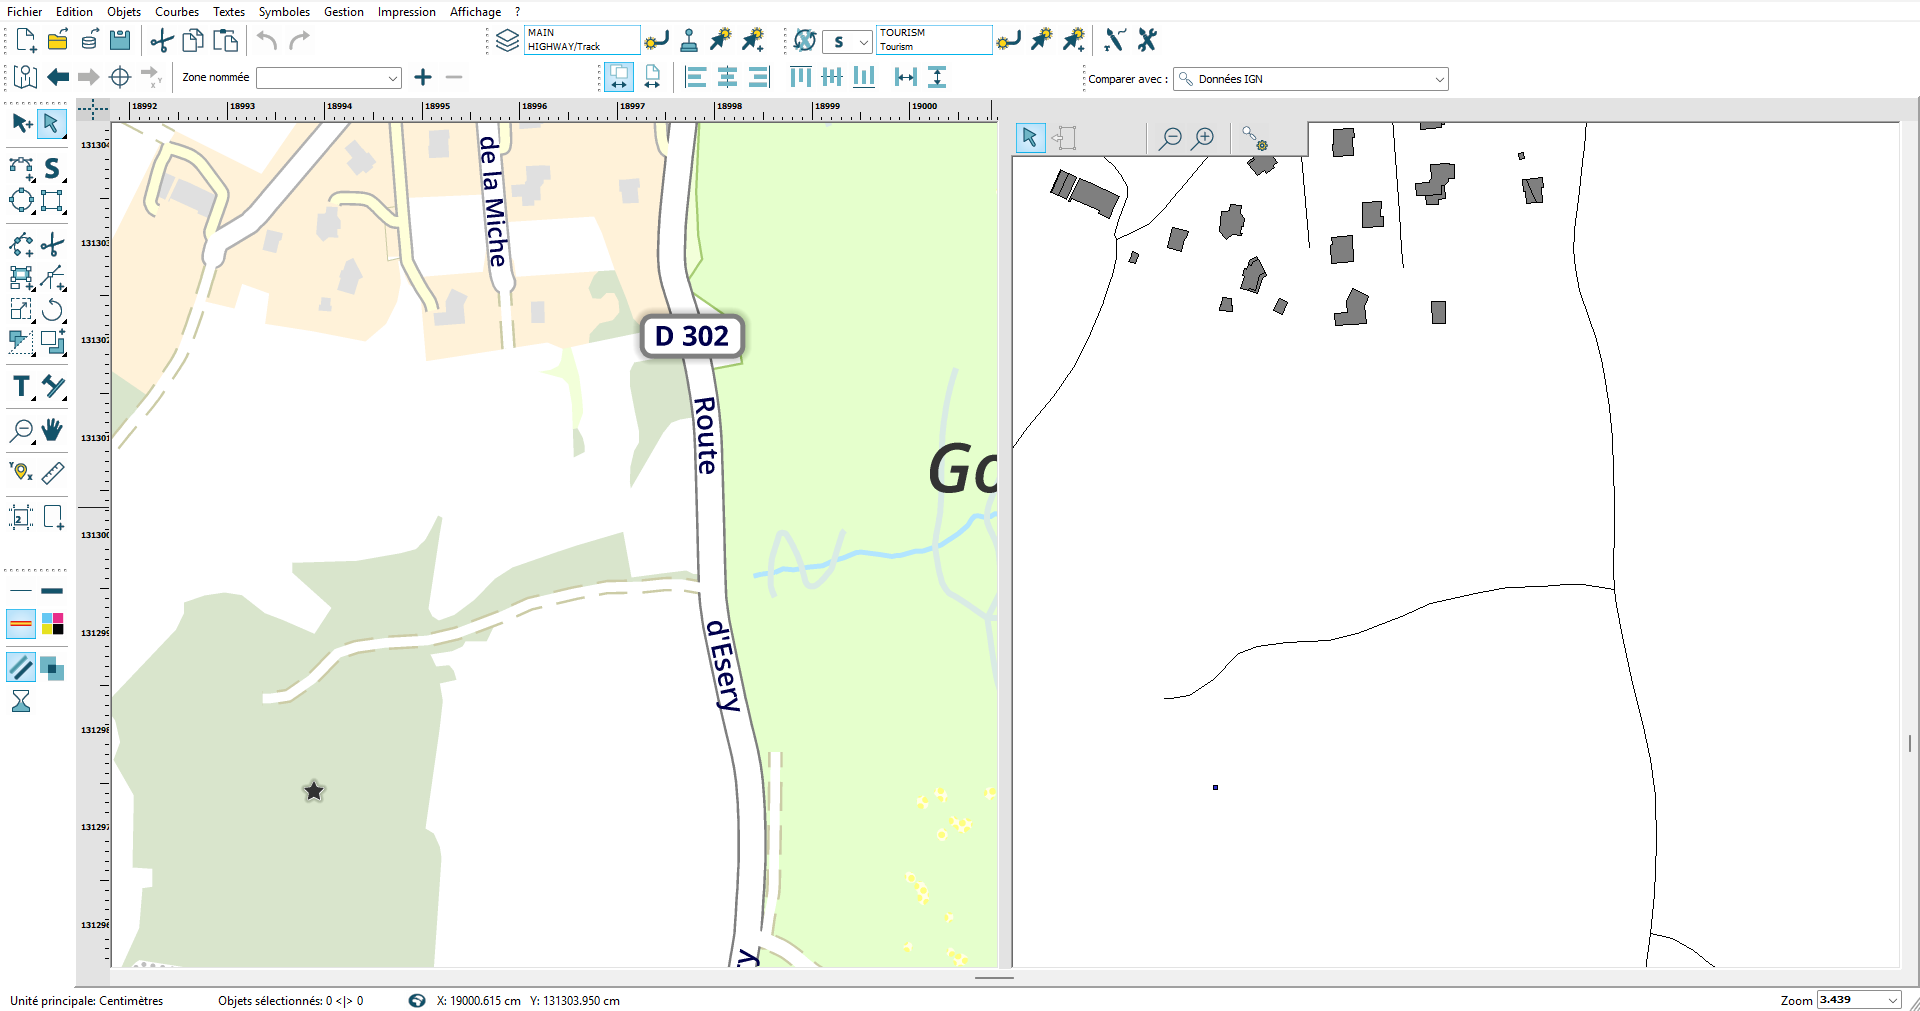
In the following example, on the left is a map created from OpenStreetMap data, and on the right, you can see the points, building surfaces, and roads from IGN data in SHAPE format.

Data Retrieval

These data can also be retrieved into the editing document, selecting the symbology to associate with them.

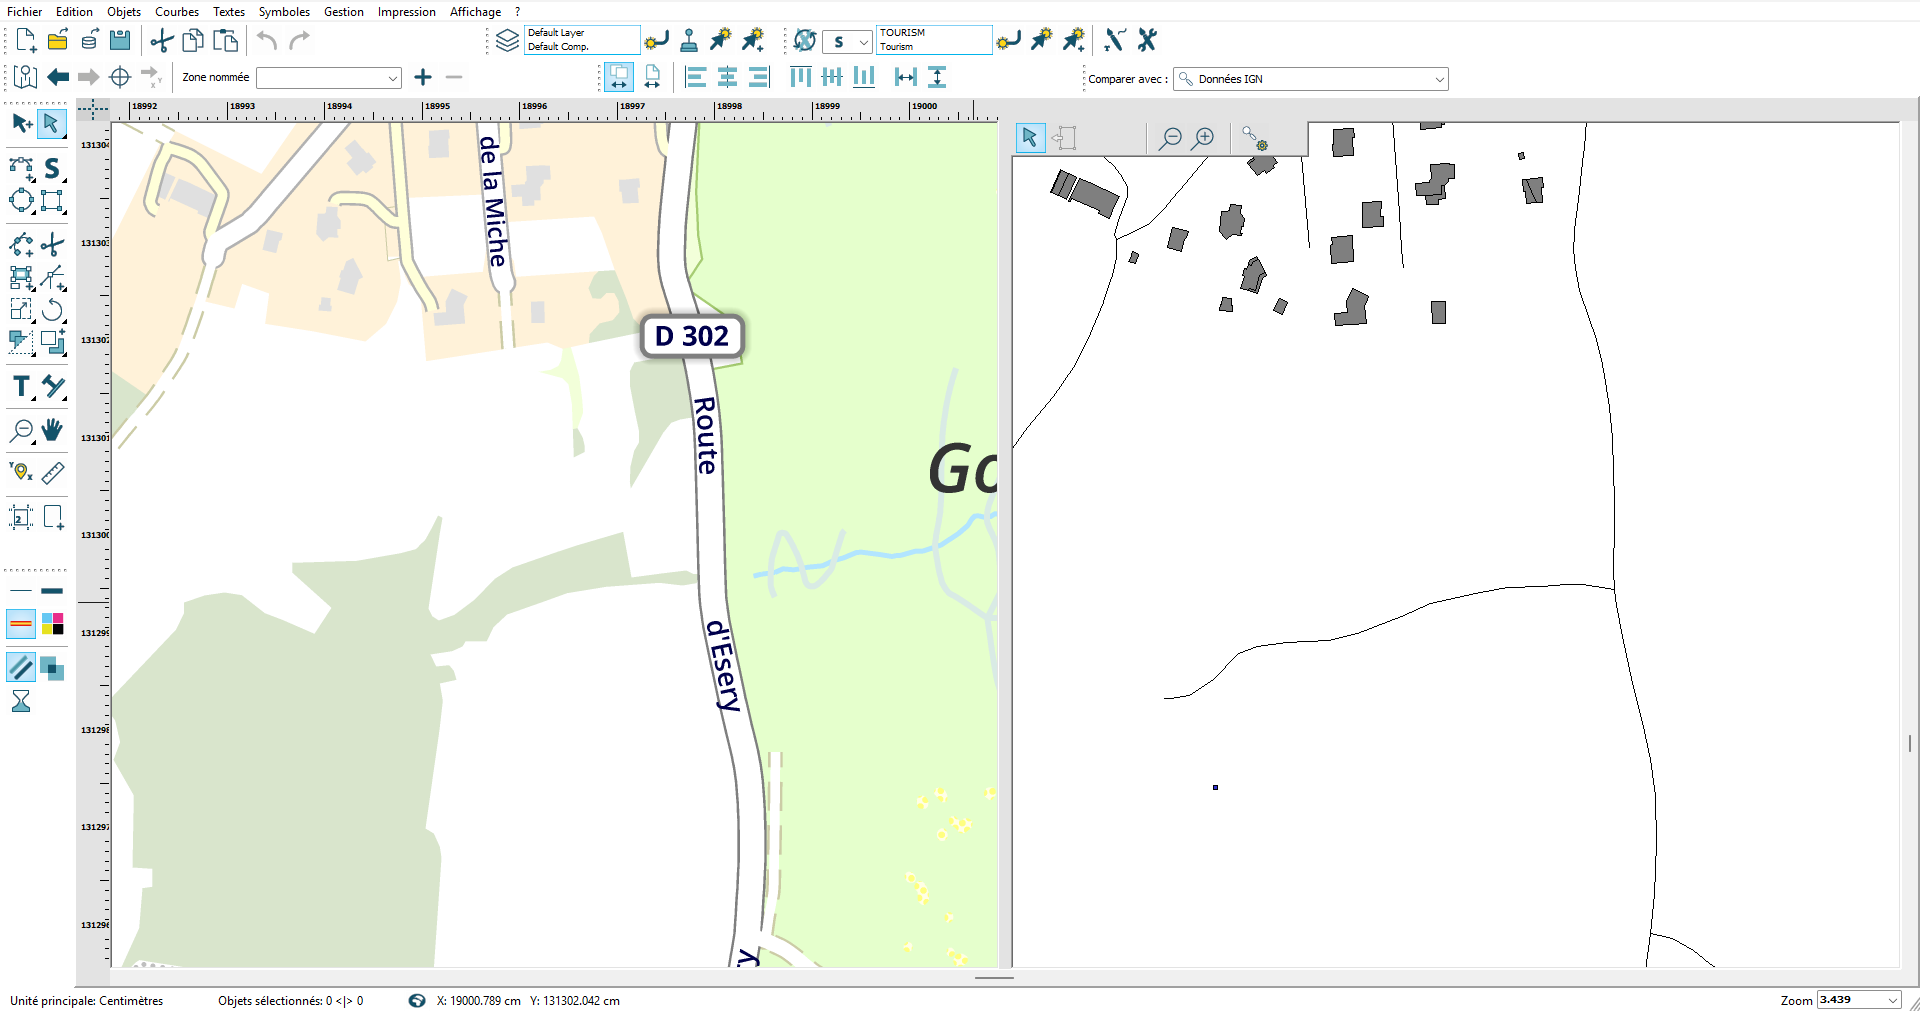
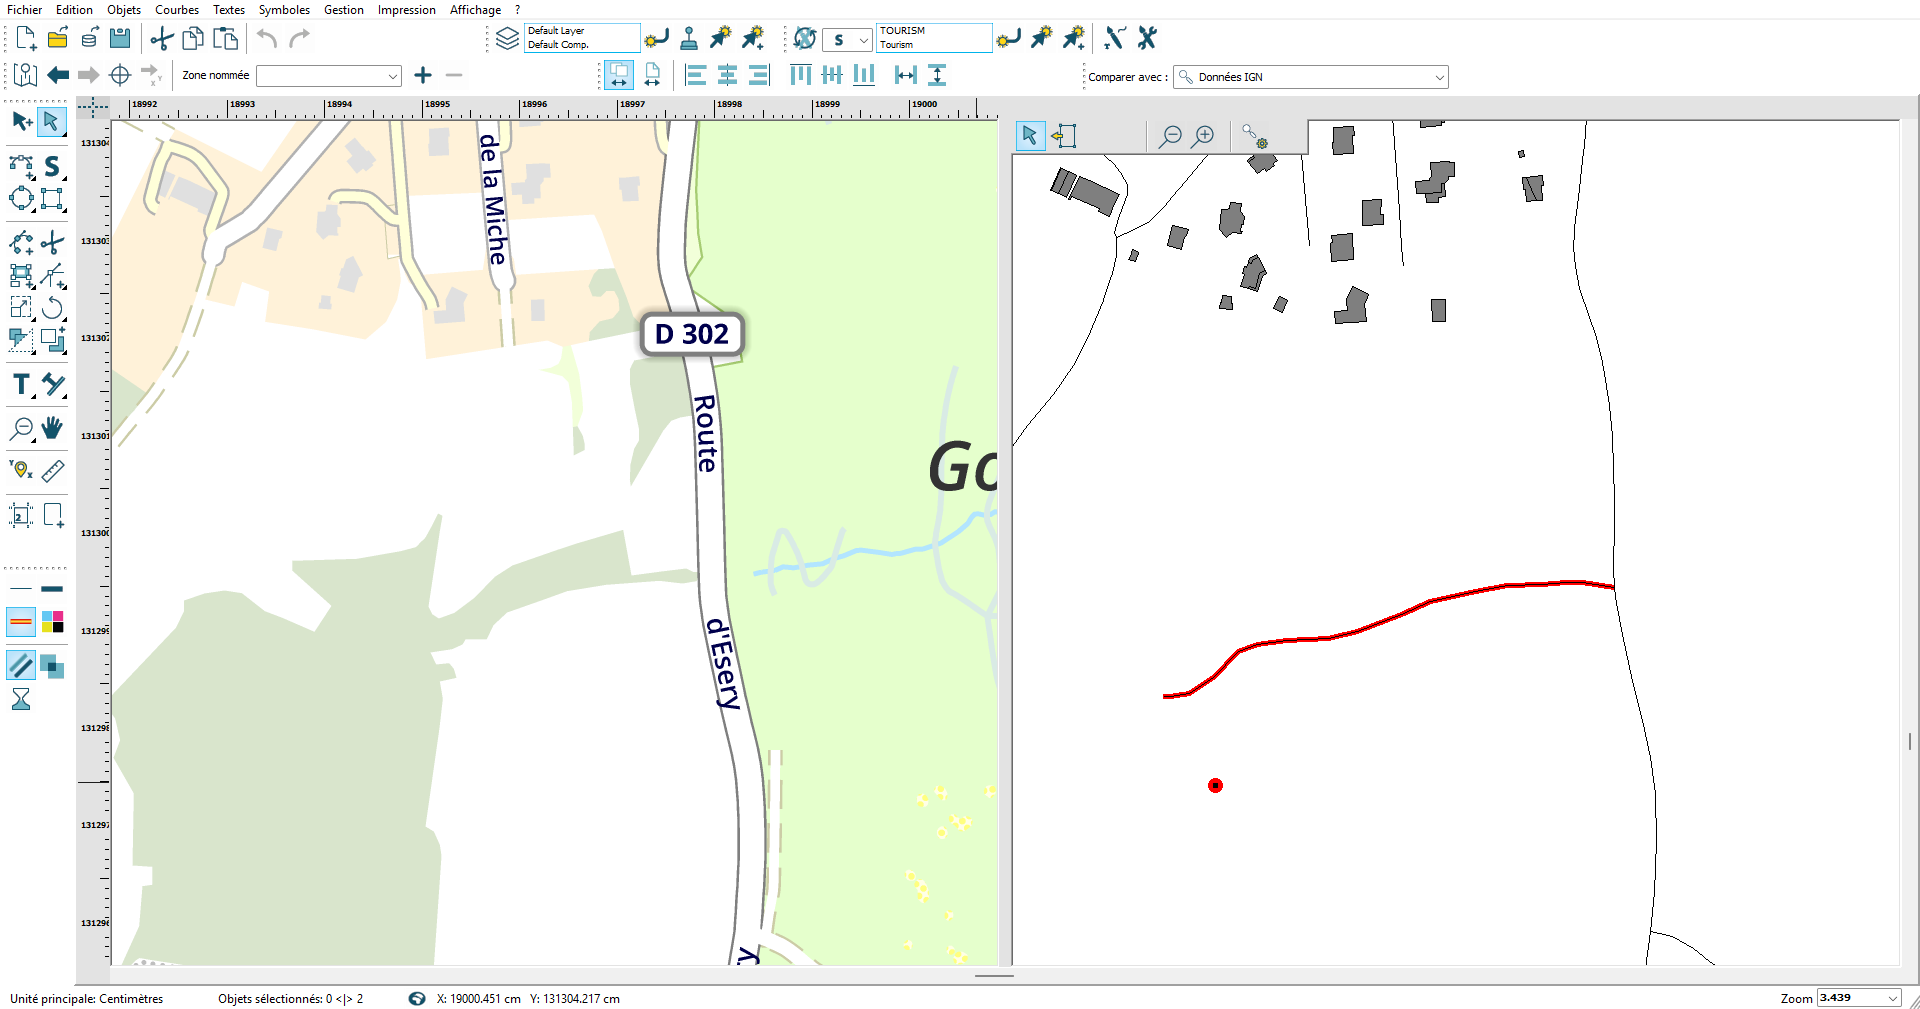
In the following example, among other, you can see a point and a polyline (road) in the displayed IGN data on the right that do not have their equivalent:

The retrieval procedure is similar:

First step: selection

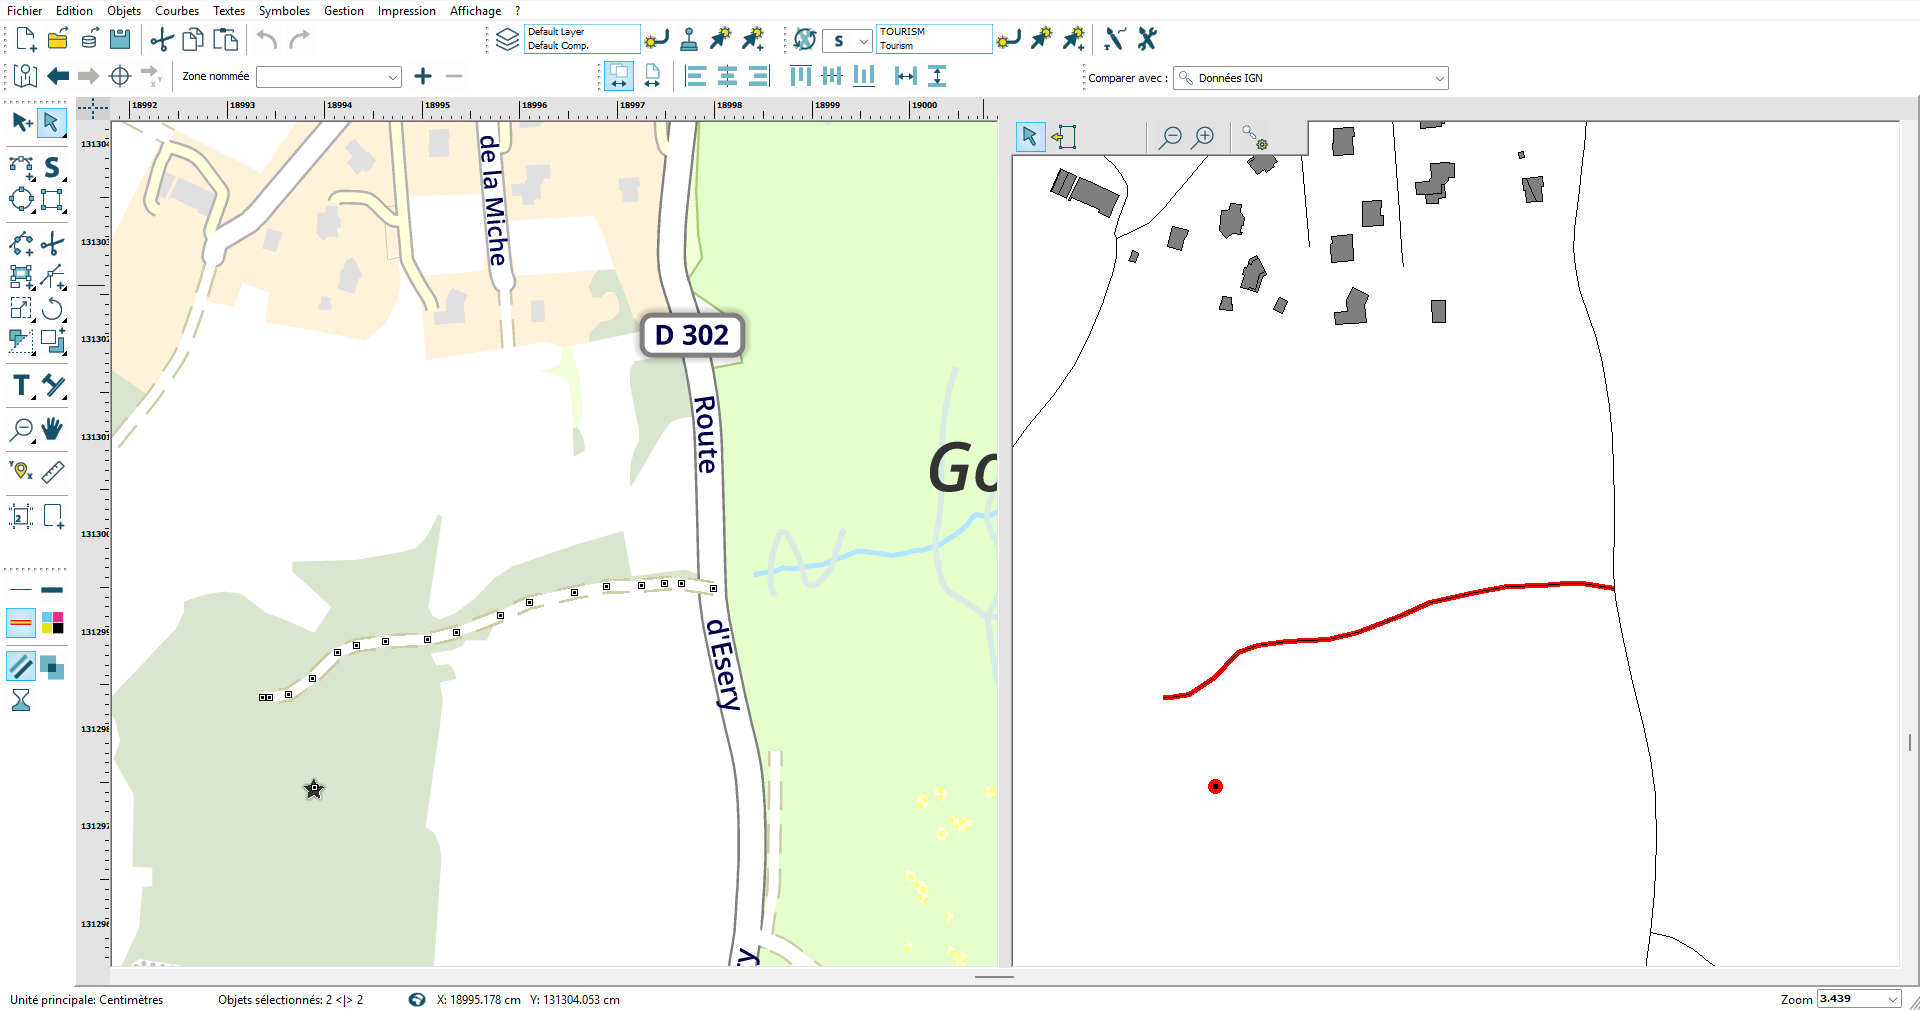
Second Step: copying to the editing document

We chose to associate the point with a symbol and designated a “secondary road” type for the polyline. The document now looks like this:

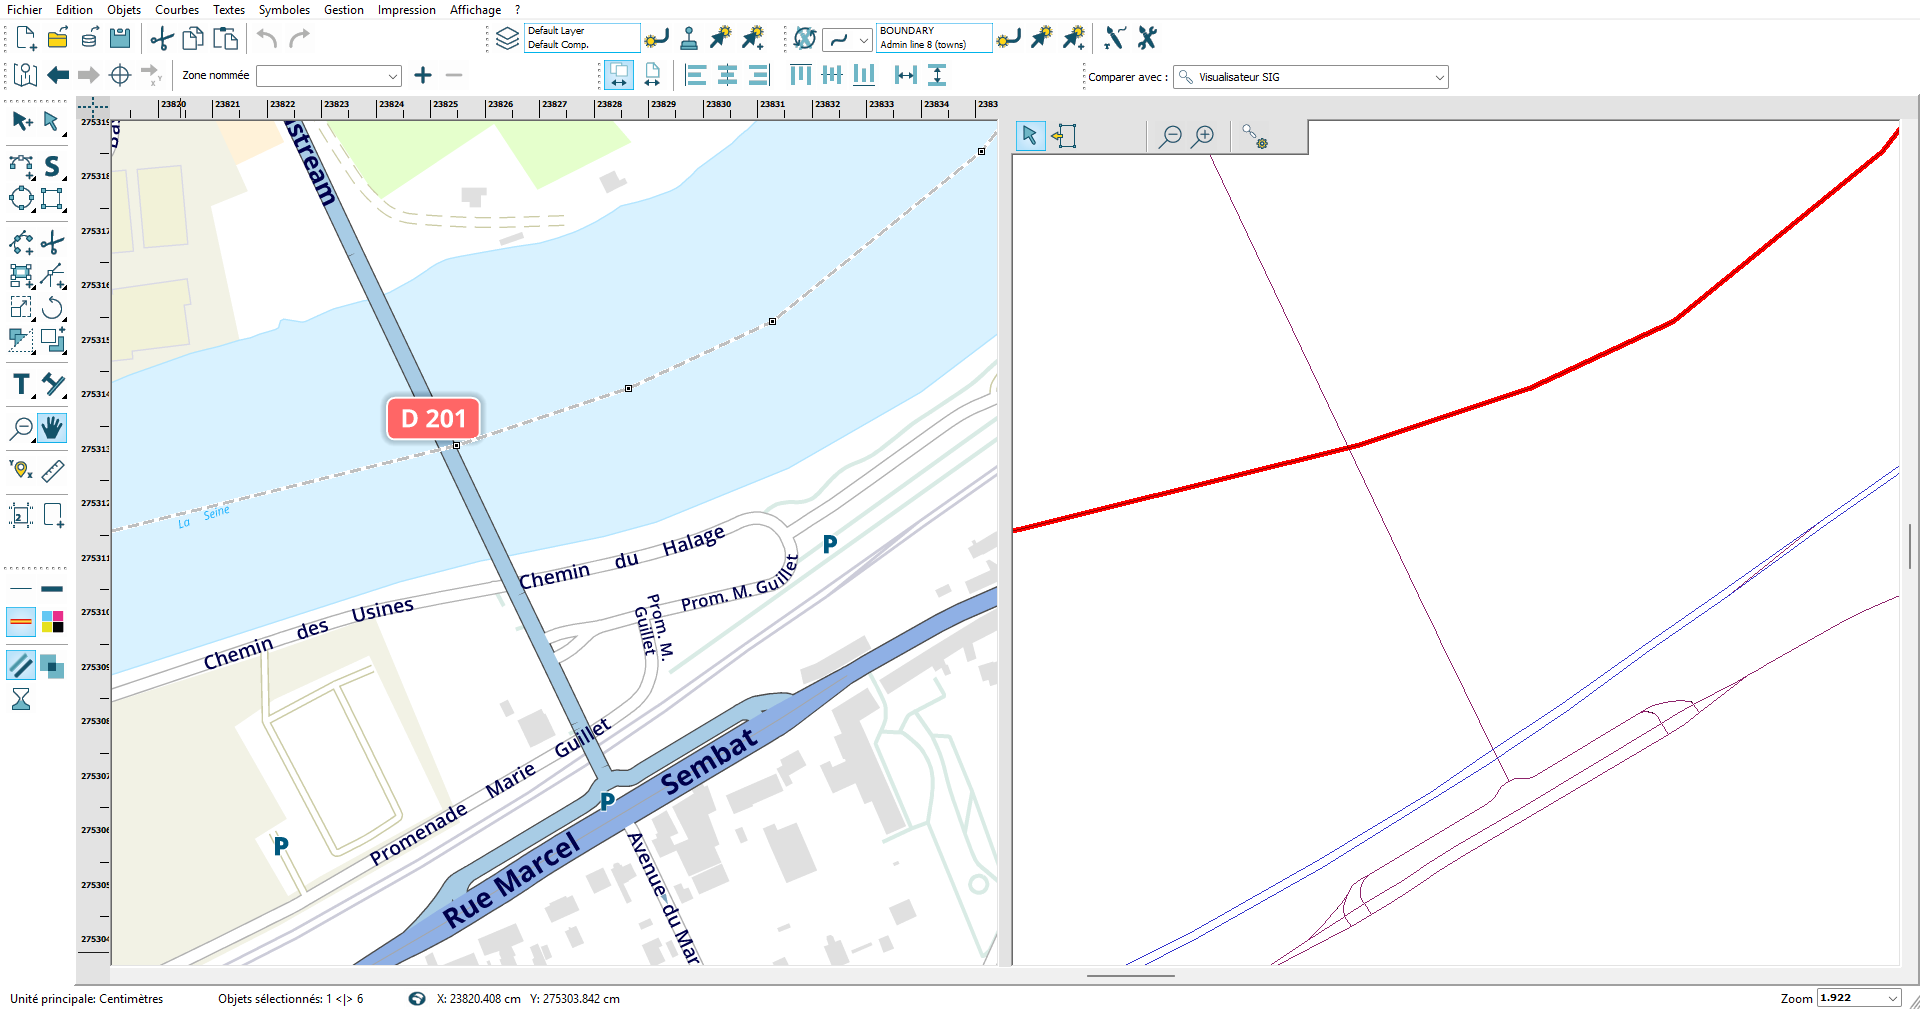
Another example with copying an administrative boundary from OpenStreetMap data:

Comparison:

Retrieval:
The Additional Features of Comparison Mode!

Multiple Comparison Documents

The same LorikCartographer document can be associated with multiple comparison documents and several sets of GIS data. The choice of comparison data to display can be modified at any time through the menu.

Information is Stored in the Document as a Reference

The reading of comparison data, whether from a LorikCartographer document or GIS sources, occurs upon selection.
You always have access to the latest update of the corresponding document.

Display Filter for Comparison Data

For LorikCartographer documents, you can manage the visibility of your layers.

Thus, on the left, you can see the comparison data with all visible layers, and on the right, with the layer containing roads hidden.

Display Filter for Comparison Data (GIS Data)

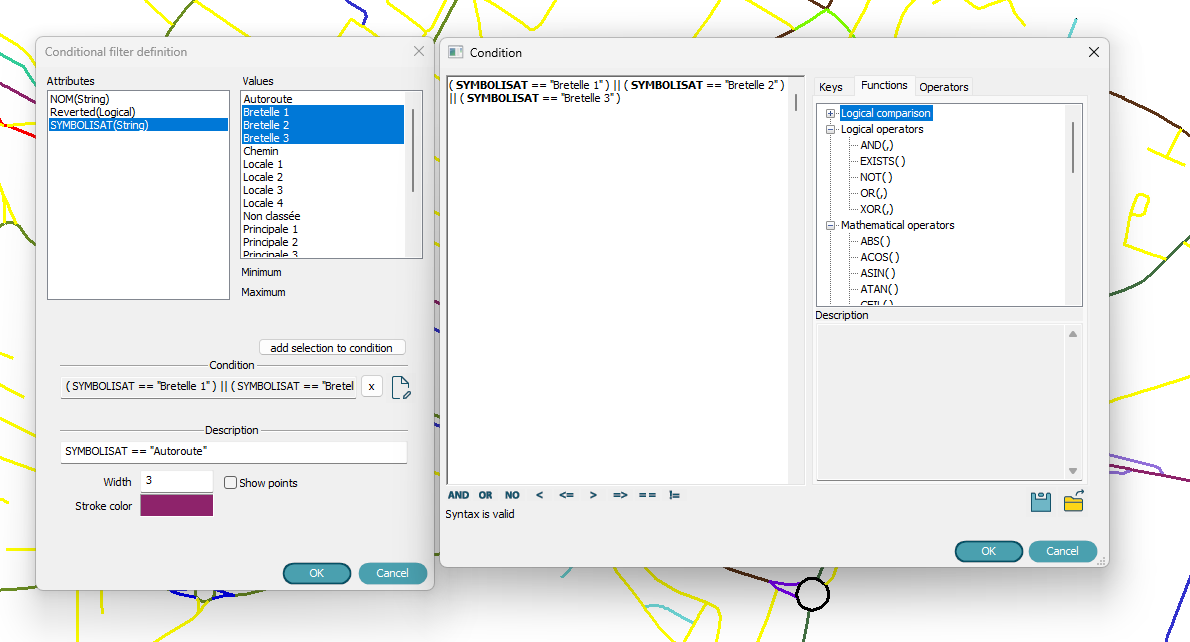
For the GIS data, the software offers filtering and styling tools based on attributes, utilizing complex conditions on entity attributes.

Information on the Selection

With extended tooltips, you can easily know the attributes of a selected entity.

Take Advantage of Automated Cartographic Creation Tools

We have seen the display of GIS data, but if you want to go further and facilitate the cartographer’s work, fully utilize the LorikSoftware range to “process” this data beforehand.

Use the LorikGISMapper software to define a processing method for these data for creating maps. It allows reprojection, symbology assignment, and text retrieval from attributes, all from the same GIS sources.

Then, add the created document as a comparison document. All other operations remain the same.

Obvious Advantages:

  • Data Filtering

Tailored to the desired representation by selecting their symbology based on attributes.

  • Display of Data with Appropriate Symbology

For example, by choosing the same symbology in the LorikGISMapper document as that in the editing document, the representation is clear, tailored, and copying becomes straightforward.

  • Pre-prepared Texts

Directly place texts on curves from one of their attributes. You just need to copy and adapt them.

  • Always Up-to-date

Data reading and all processing occur during the display of the comparison data. You are always up-to-date.

In the following example, the GIS data is the same as in the previous instance, but this filtering allows immediate access to roads with their text, symbols, and surfaces already utilizing the correct symbology. You just need to copy and adapt them.

Go further!

You can find on these links:

▪️An overview of the application: Overview

▪️A dedicated page detailing license pricing: Plans & pricing

▪️A description of all geoprocessing tools: Tools List

▪️Detailed documentation on using LorikGISTools: Documentation

LORIENNE

CONTACT

14, rue de la Beaune 93100 Montreuil, FRANCE
+33 (0)1 48 51 12 12
contact@lorienne.com

© LORIENNE – 2025 – Legal information – privacy