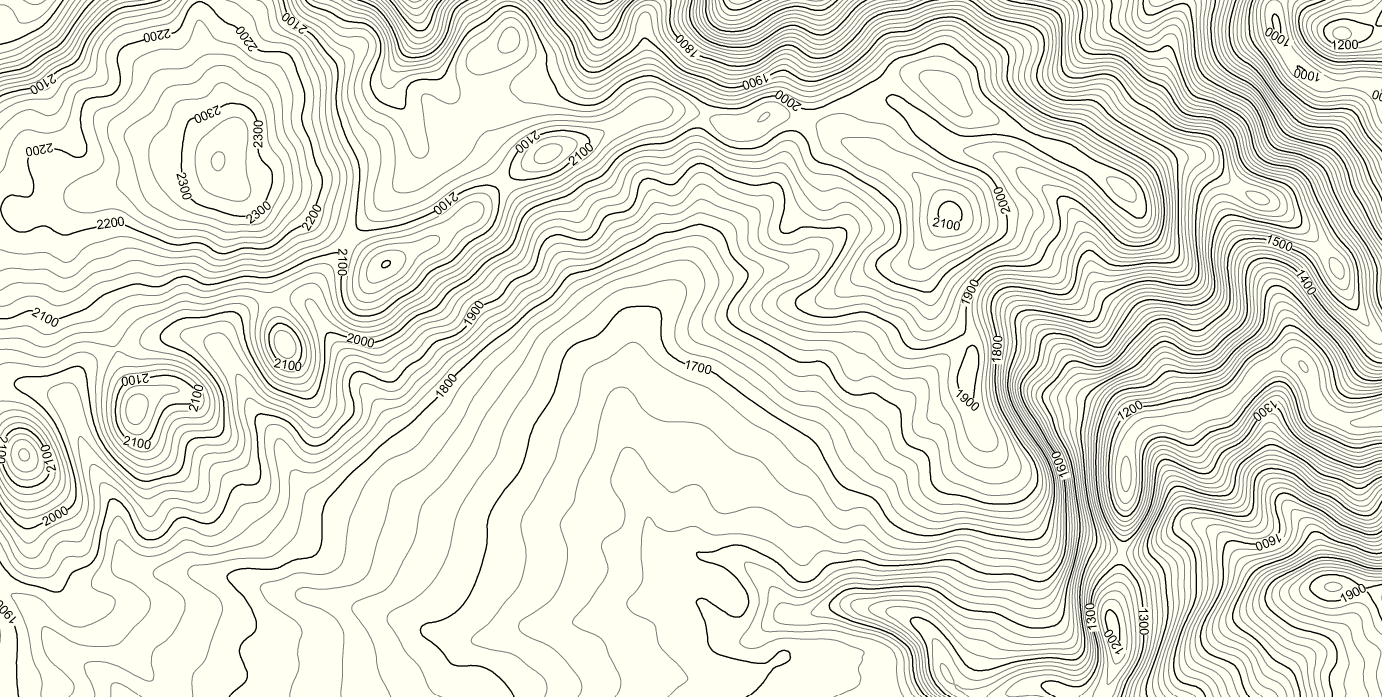
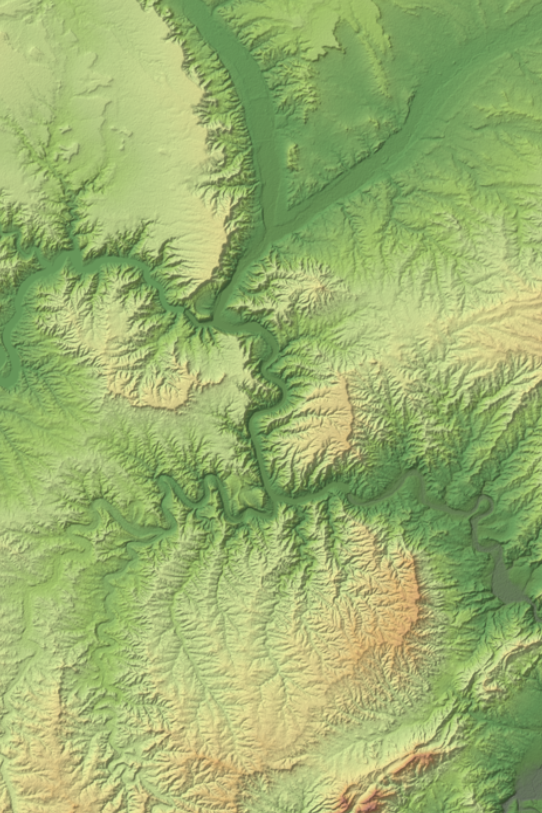
The contour line generation accuracy in a GIS like LorikGISTools
• • •
Generating contour lines?
Concretely, how does it work?
Generating contour lines from digital terrain models (DTMs) is a common need for GIS users.
LorikGISTools offers a simple, very fast, powerful solution of unmatched quality.
Moreover, these contours cover as many DTMs as desired provided they are defined in the same georeferencing and the same grid parameters, and they can be computed in any georeferencing including one different from that of the DTMs.
Closeness to reality
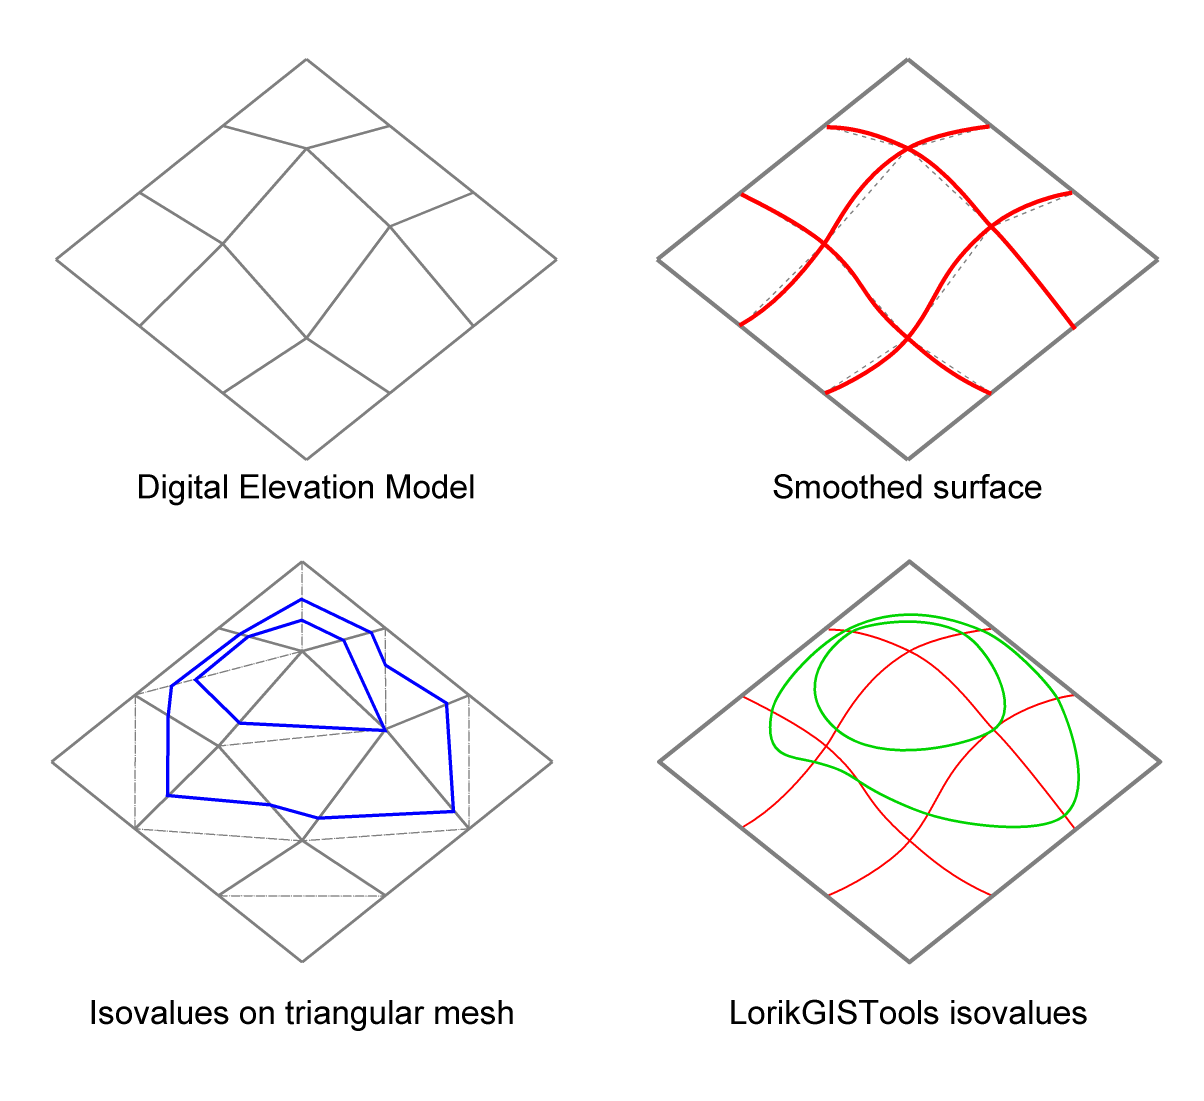
Unlike common algorithms in the GIS world, LorikGISTools first smooths the segments between points as curves computed from the neighboring points via interpolation, derives the corresponding surfaces from them, and computes contour lines on those surfaces.
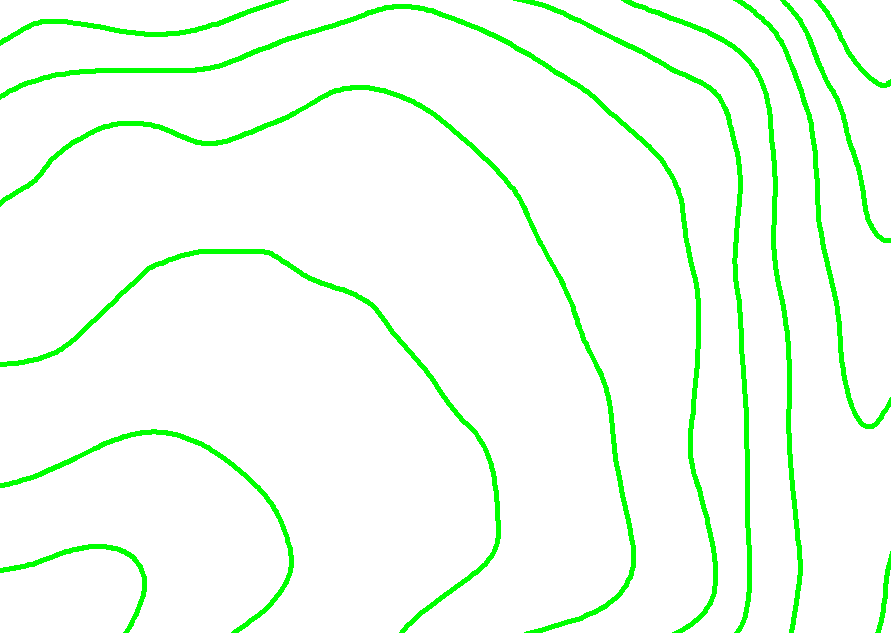
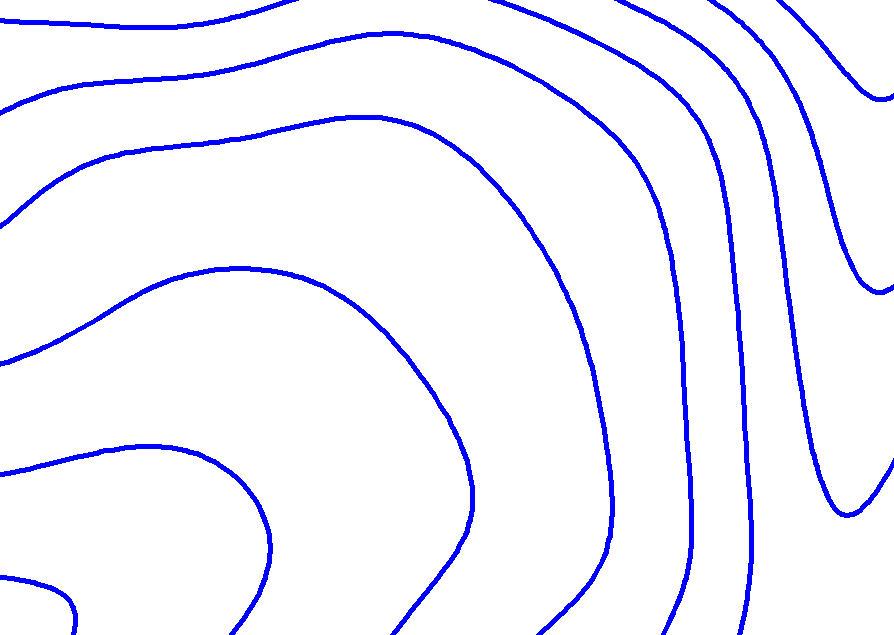
This yields several advantages: a greater closeness to reality, no break between two rectangles of the DTM grid and consequently no curvature break on contour lines at the boundary of those rectangles.
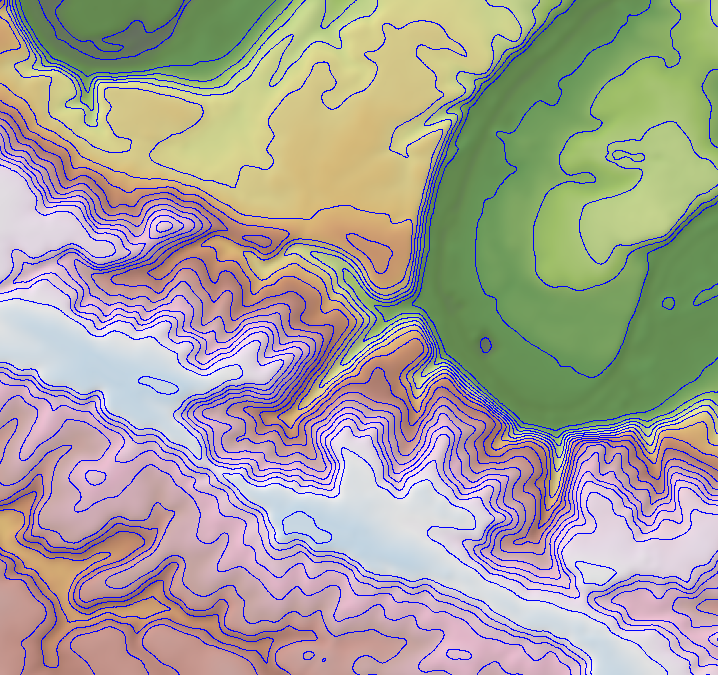
The contour lines are smooth and accurate:
Data improvement
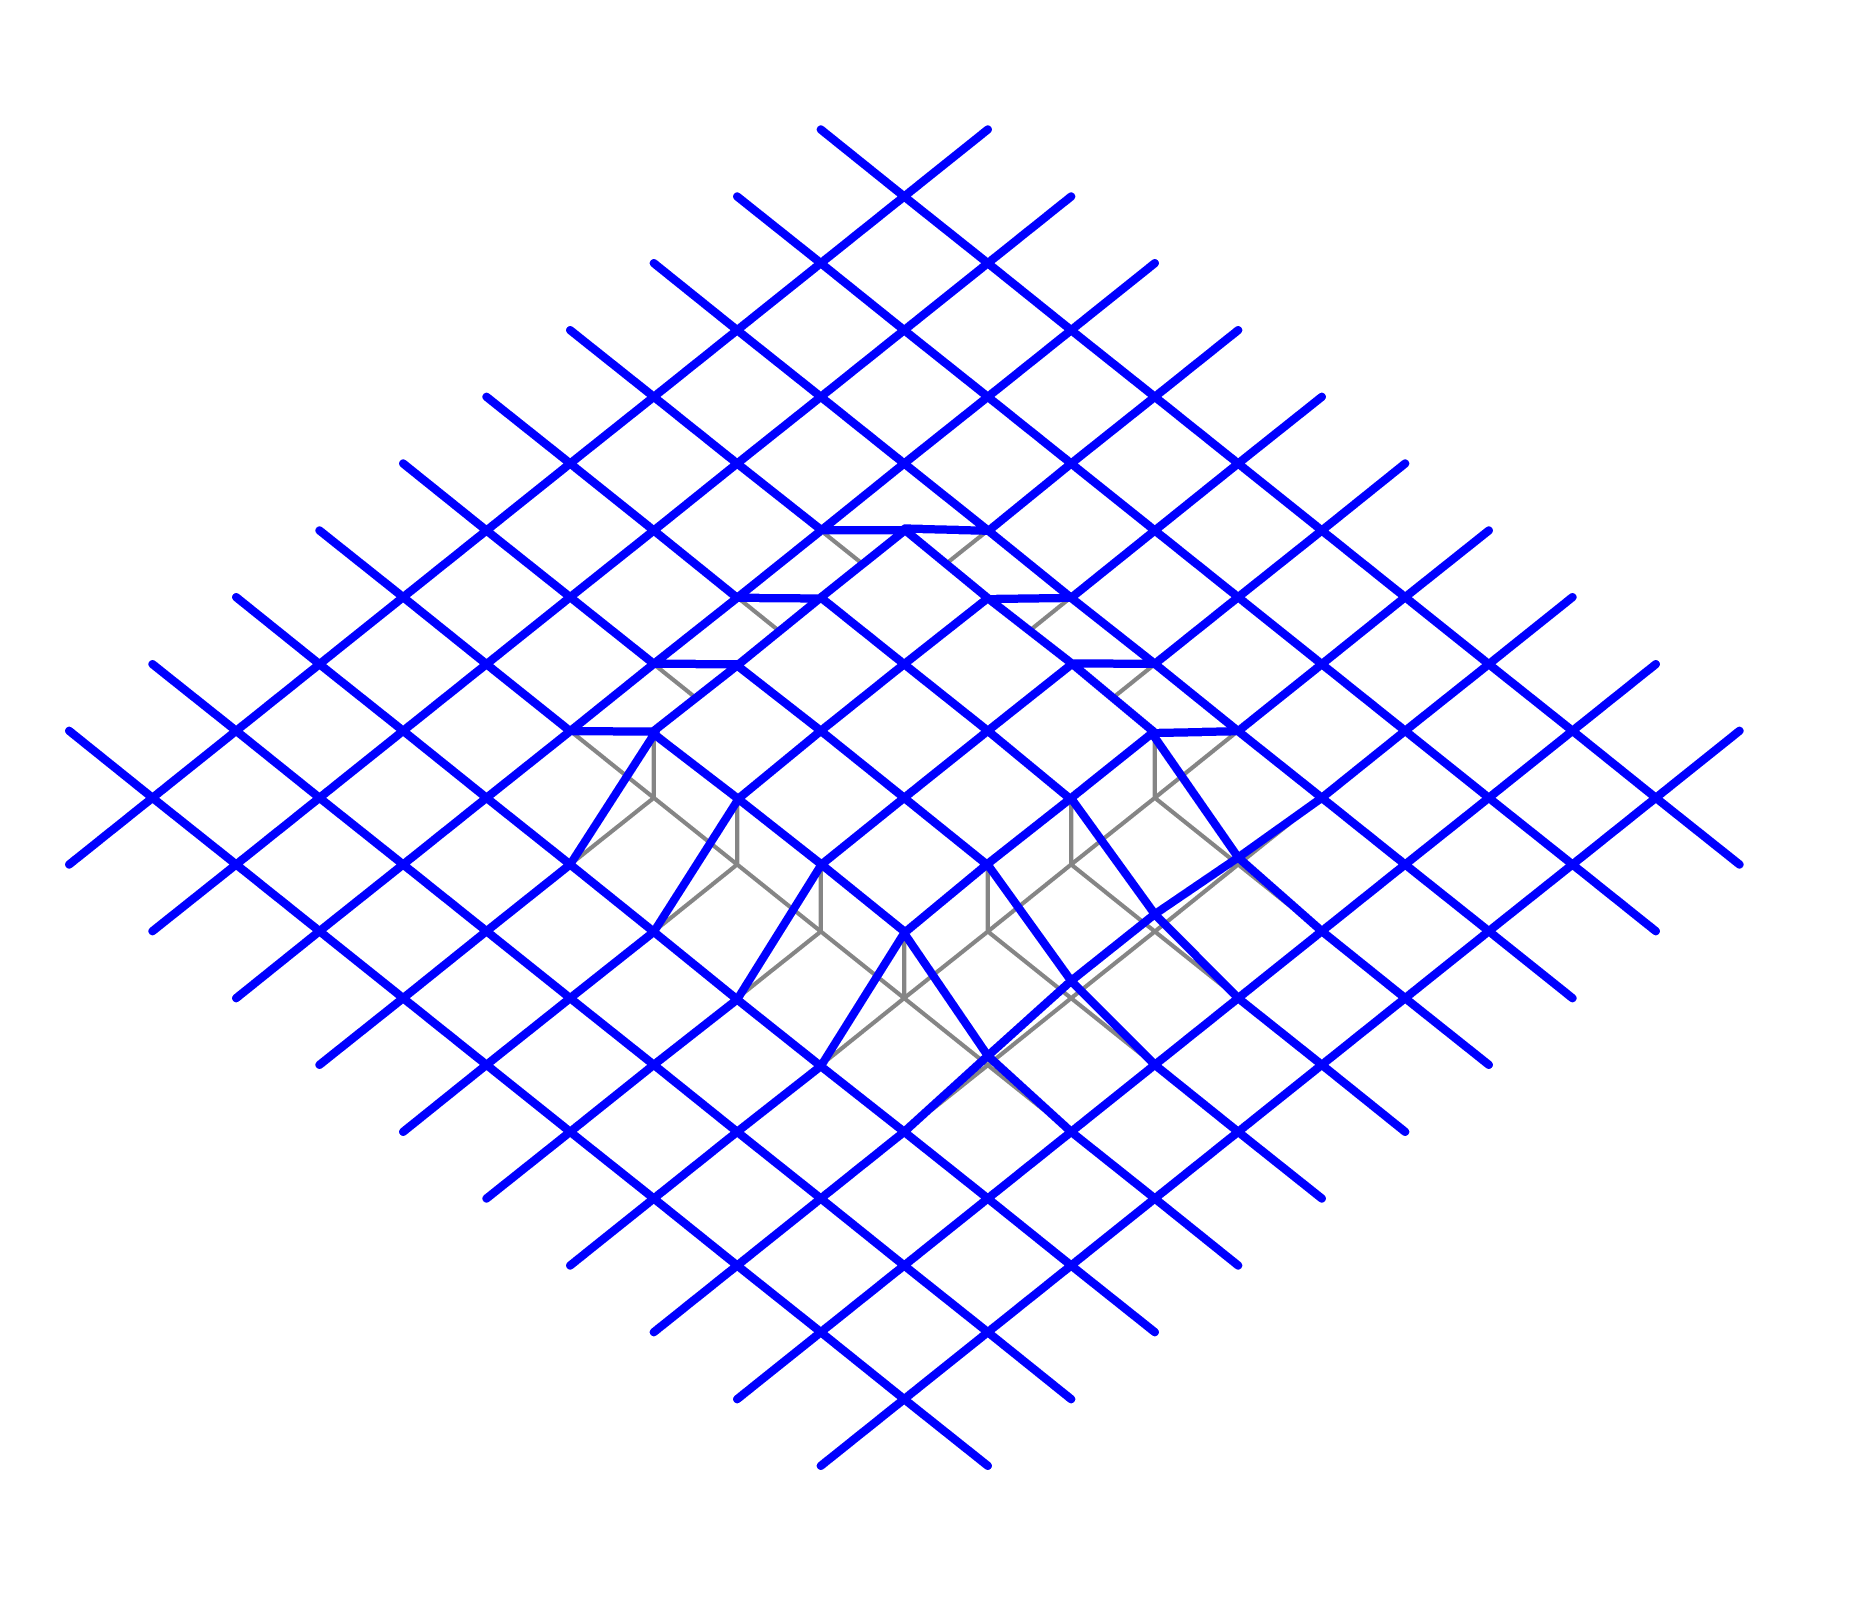
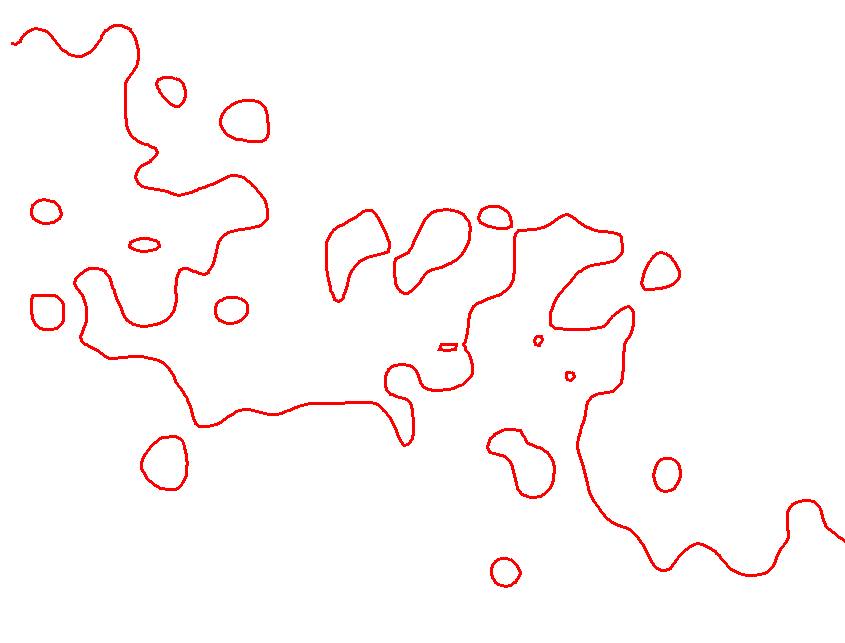
A digital terrain model with low-precision data produces a surface with many breaks as well as many flat areas.
This can be compensated in LorikGISTools by smoothing the elevation values at the DTM points. It uses the Gaussian method with the ability to define the standard deviation.
This is a property of DTM layers accessible in the layer inspector:
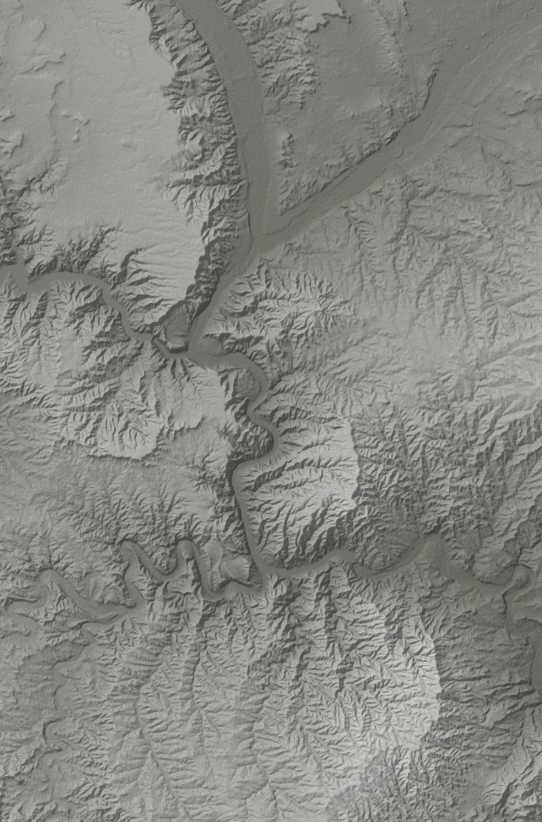
(This is also used for creating hillshade images)
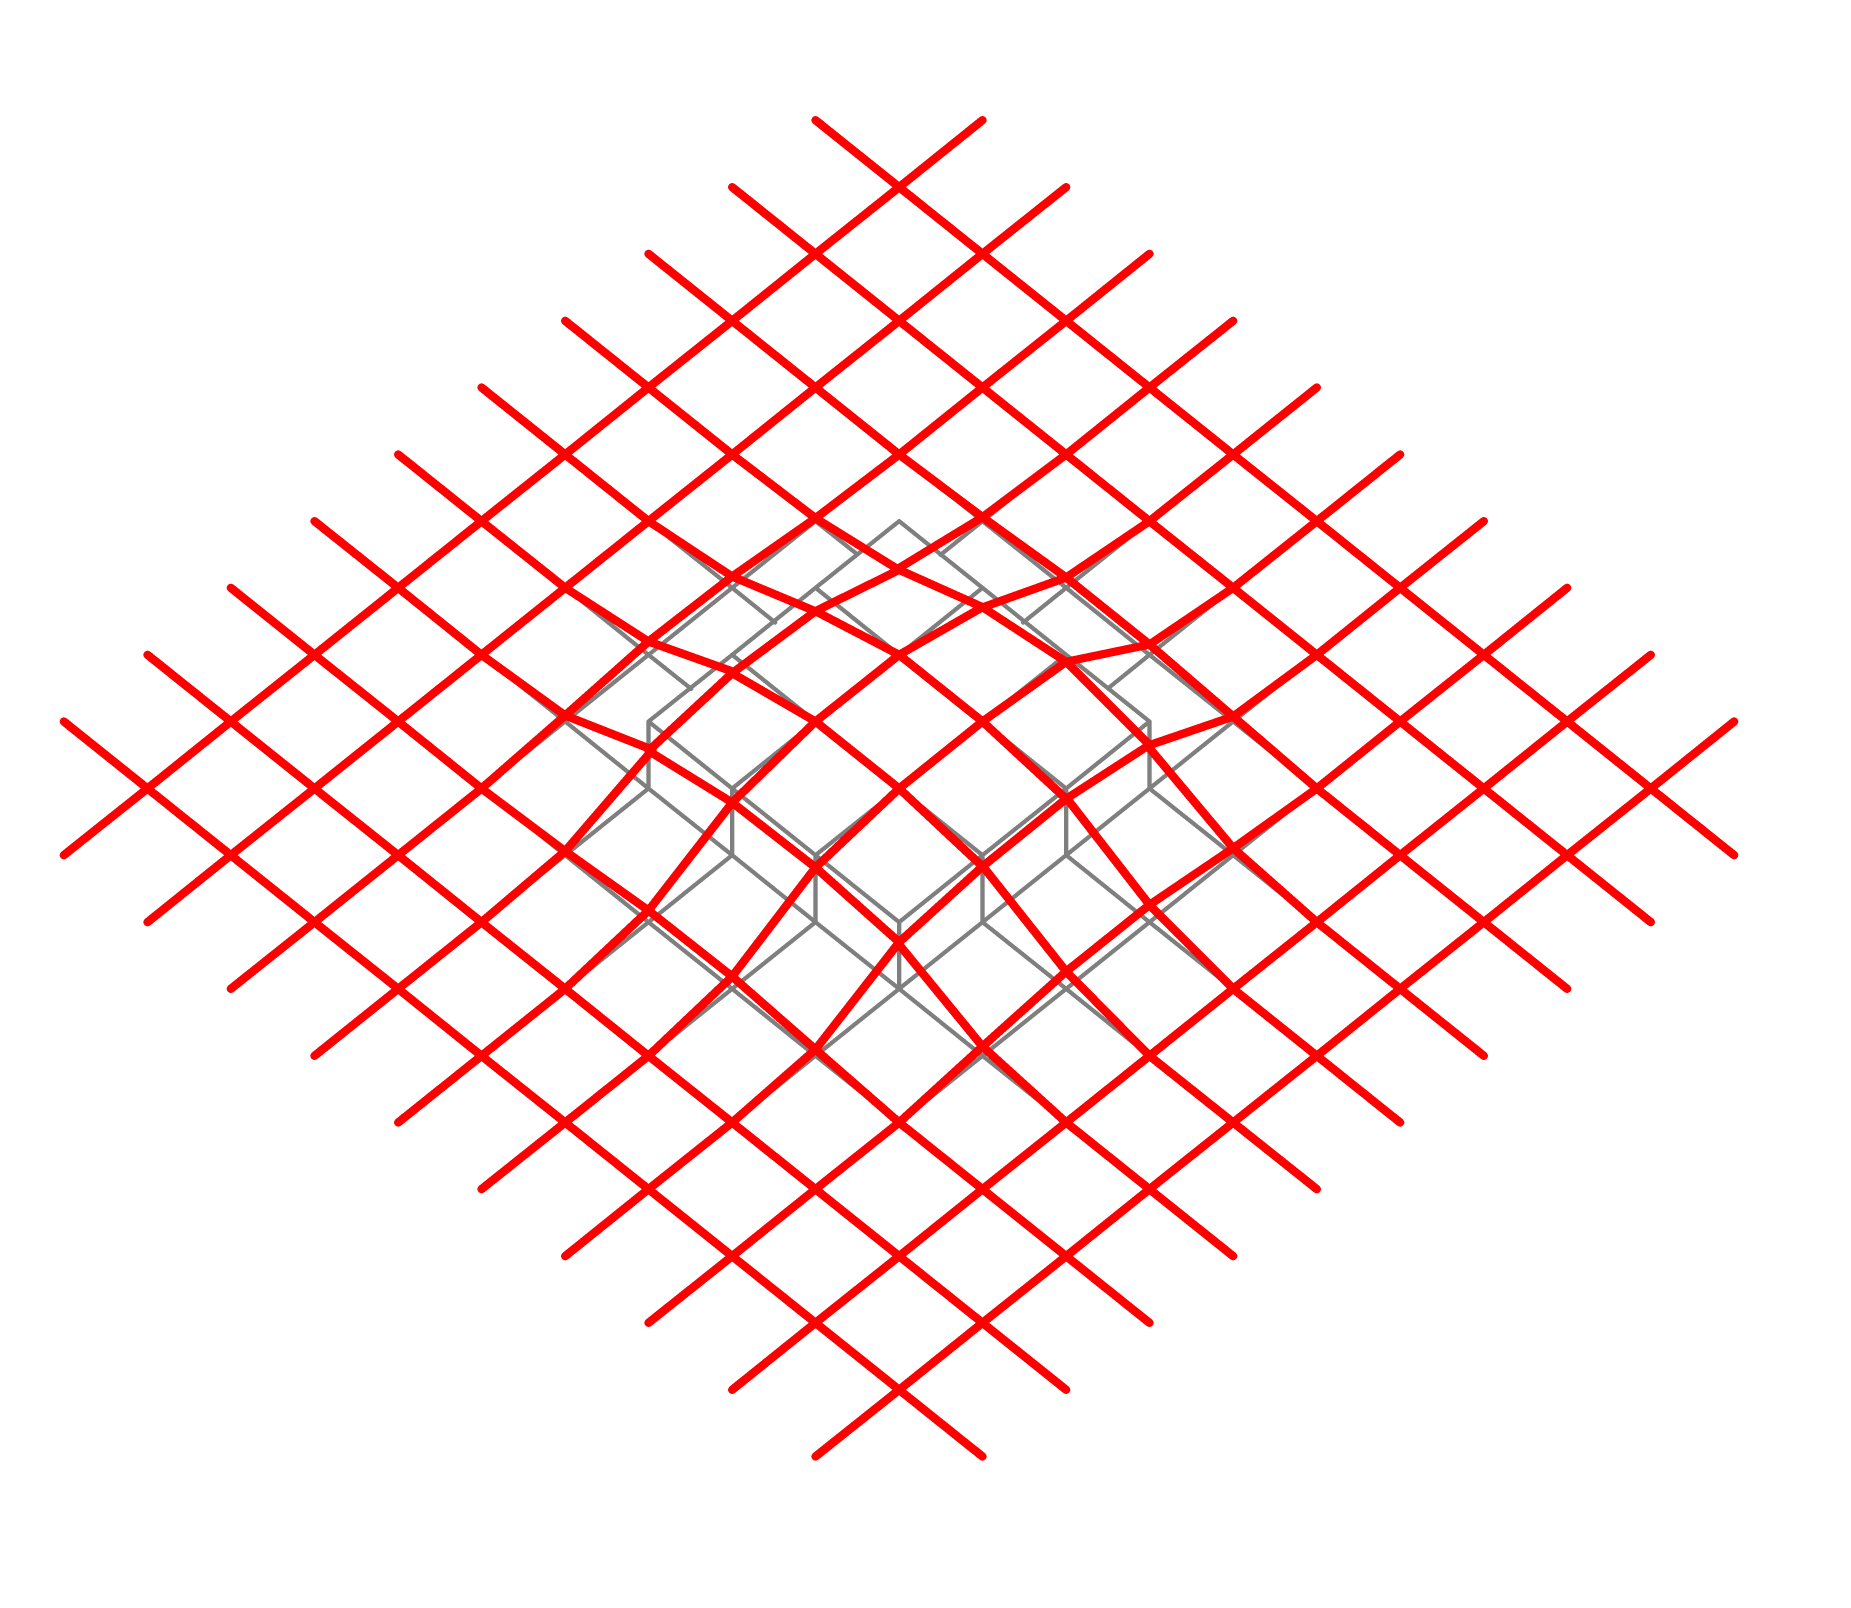
The result looks like this:
The resulting surface is closer to reality and further minimizes discontinuities, which has a significant impact on the quality of the contour lines.
Scale adaptation
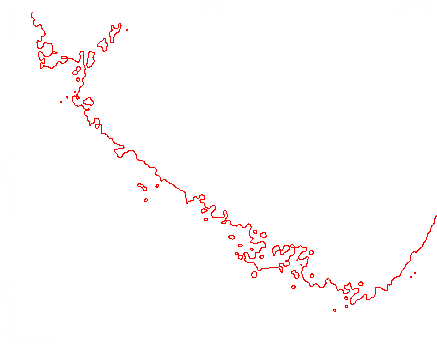
The reality of contour lines at a large display scale has the major drawback of creating many small oscillations that are irrelevant at that scale:
small scale
large scale
It is completely inappropriate to smooth the resulting contours because we would create curve segments that are too far from reality, which implies significant altitude variations especially in steep areas; worst of all, the contours curves could end up crossing.
But it is possible to smooth the DTM surface in a way adapted to the desired scale, then compute the contour lines.
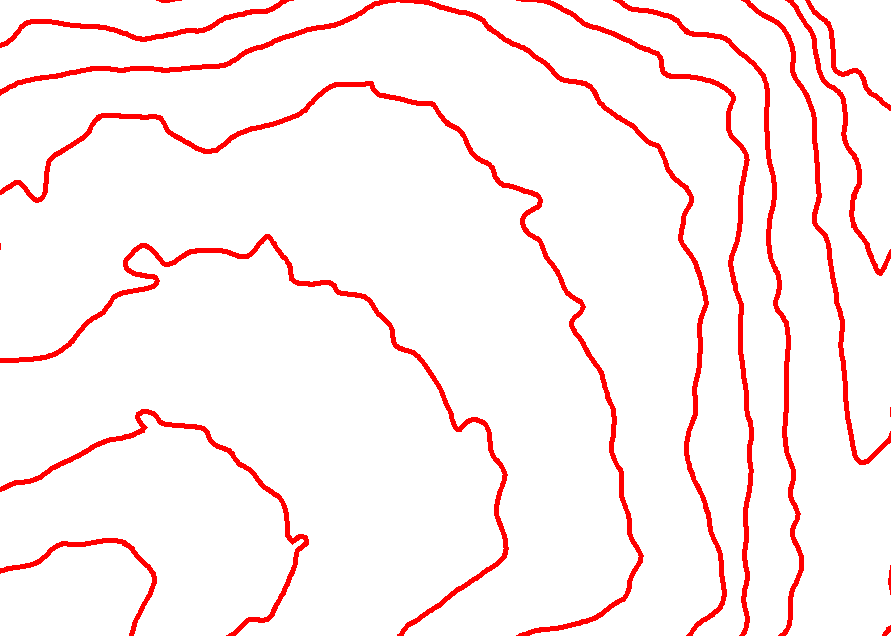
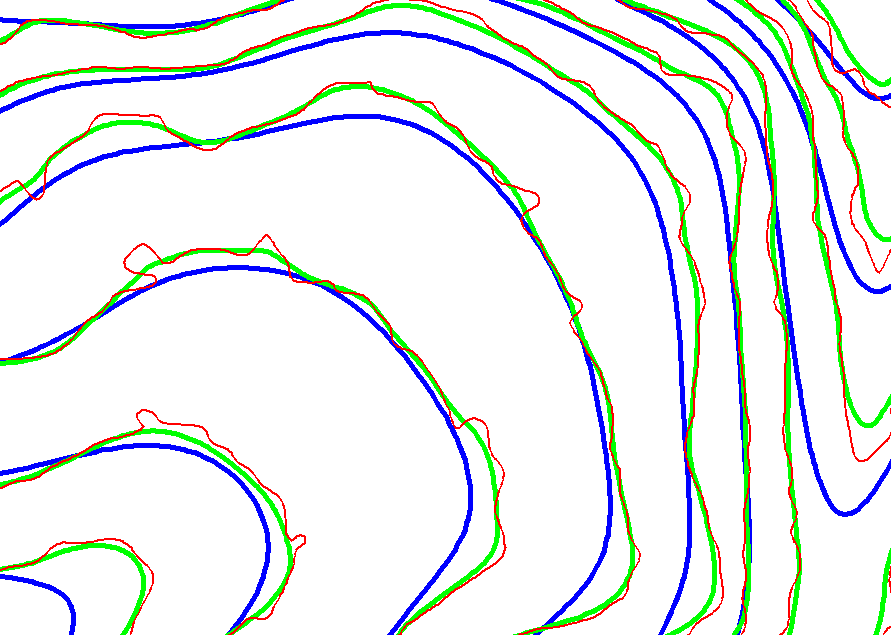
And we can simply uses the smoothing of elevation values at points described above by varying the standard deviation value, which gives us:
no smoothing
medium smoothing
strong smoothing
Display in overlay mode to better understand the different smoothing types:
Creating contour lines
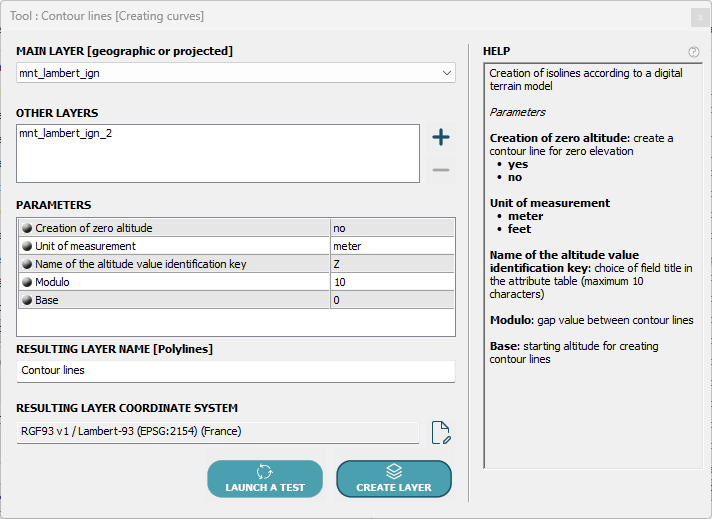
DTM ⇒ Creating curves ⇒ Contour lines.
Very simple to use, it appears as follows:
Start by choosing the layer containing a DTM.
Add, if needed, other layers containing DTMs in the same georeferencing and aligned on the same grid.
You will then find the parameters:
Creation of zero altitude allows to avoid creating the zero-elevation contour.
Name of the altitude value identification key: the created layer will contain a field to store the elevation value of each contour, and here you can choose its name.
Unit of measurement used both for the field used for elevation and for defining offsets, to choose between meter and foot.
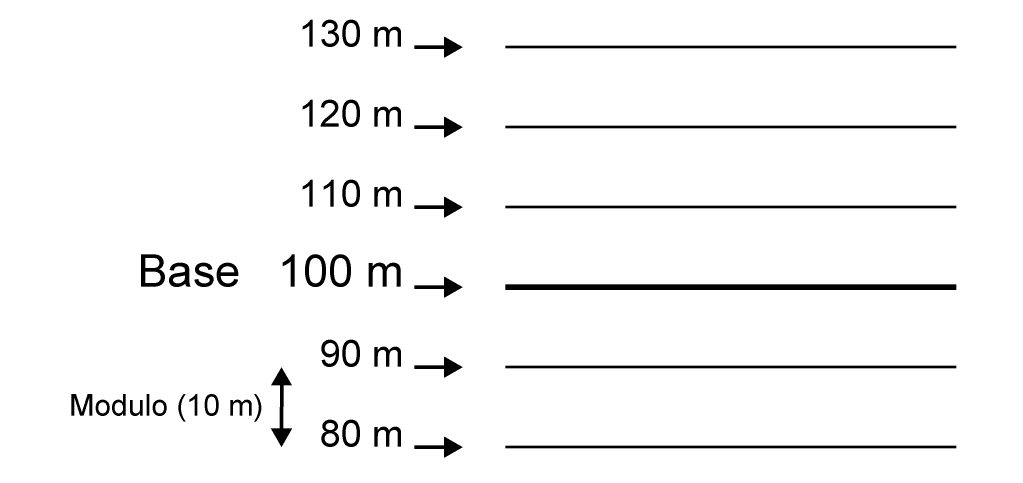
Base and Modulo to specify the desired elevations, as in the following example:
Finally, enter the name of the layer to be created as well as its georeferencing.
